Red Sea Bottom Pressure Variability
funded by King Abdullah University of Science and Technology (KAUST)
funded by King Abdullah University of Science and Technology (KAUST)
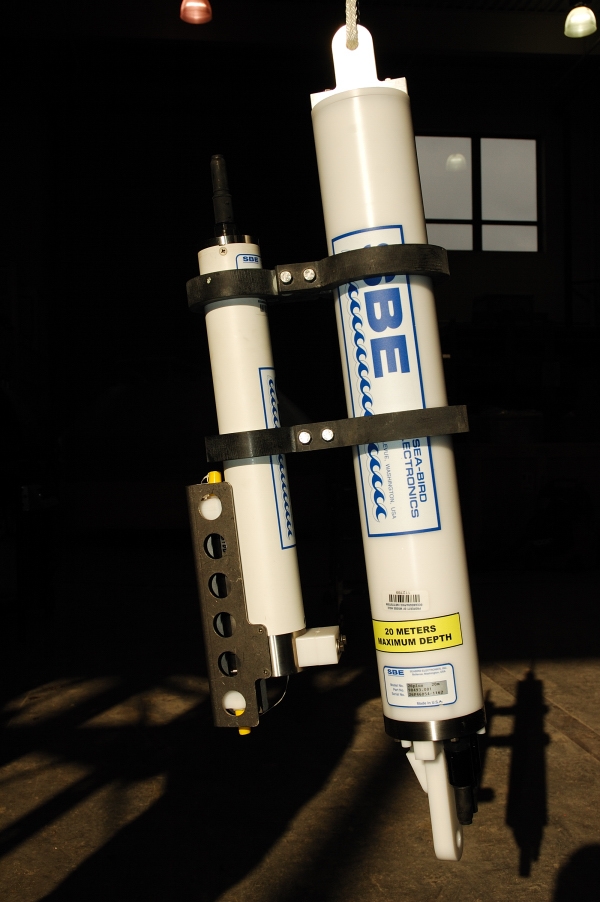
We deployed an array of three bottom pressure/temperature/conductivity (PTC) instruments during 2008-2011 at Jeddah (JP), Thuwal (TP) and Rabigh (RP) along the Saudi Arabian coast near the KAUST study site. This PTC array will accurately measure the regional tidal variability of the sea surface and characterize the low frequency along-shore and across-shore pressure, temperature and salinity gradients and their variability. The bottom pressure instruments measure total pressure (water pressure plus atmospheric surface pressure) continuously with an accuracy of about 1 mm and will record an average pressure approximately every 5 minutes. This technique will effectively filter out small amplitude surface waves over the averaging period. To estimate the sea surface elevation (SSE), we subtract the atmospheric surface pressure (obtained from a nearby meteorological station or buoy)) from the total pressure and calculate the depth of the instrument from the remaining pressure using the local water density (computed using the co-measured temperature and conductivity data) and hydrostatics. The most energetic component of SSE variation is normally the diurnal or semidiurnal tide. We will be able to calculate the surface tidal constituents at the deployment locations with a high level of accuracy, and use these results with other high-quality tidal data to test and improve bothlocal- and regional-scale numerical tidal models. After subtracting the tidal constituents from the SSE time series, we will look at the subtidal SSE variability that is dynamically linked with the low-frequency current variability. In particular, the along-coast and cross-shelf SSE gradients play key roles in the along- and cross-shelf momentum equations, and the direct estimation of these gradients using the proposed bottom PTC data will provide important insight into the wind driven currents and critical data to assimilate into the proposed regional circulation model.Real-time Data 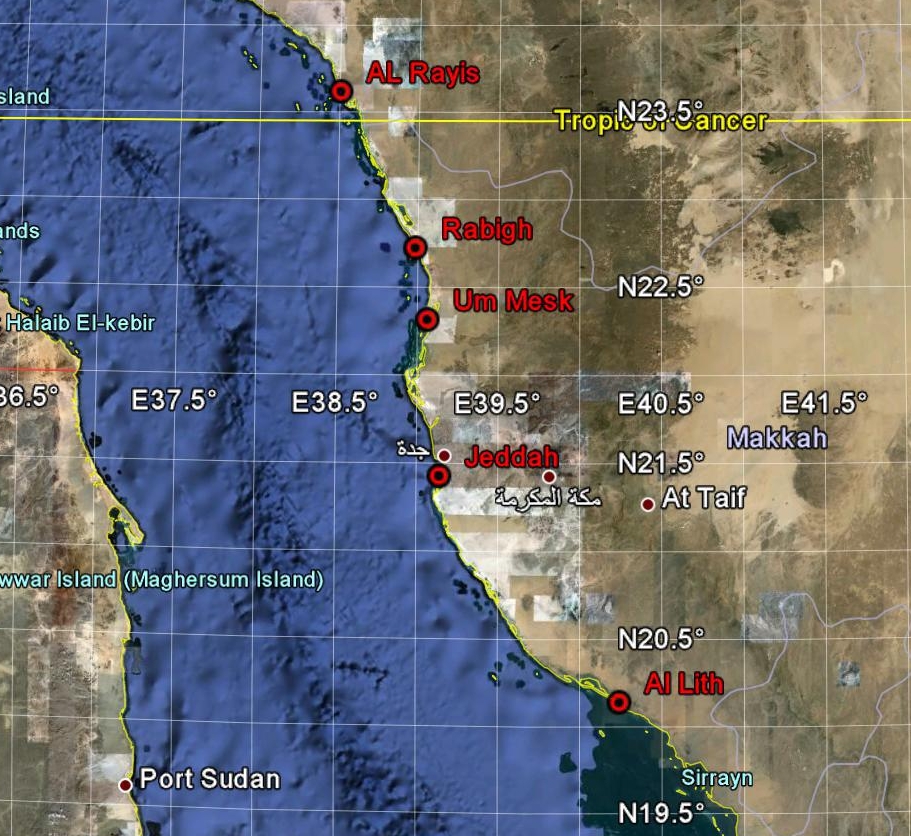 Figure 1. Locations of bottom pressure instruments at Jeddah, Qadimah and Rabigh. Solid white circles every 2 days. 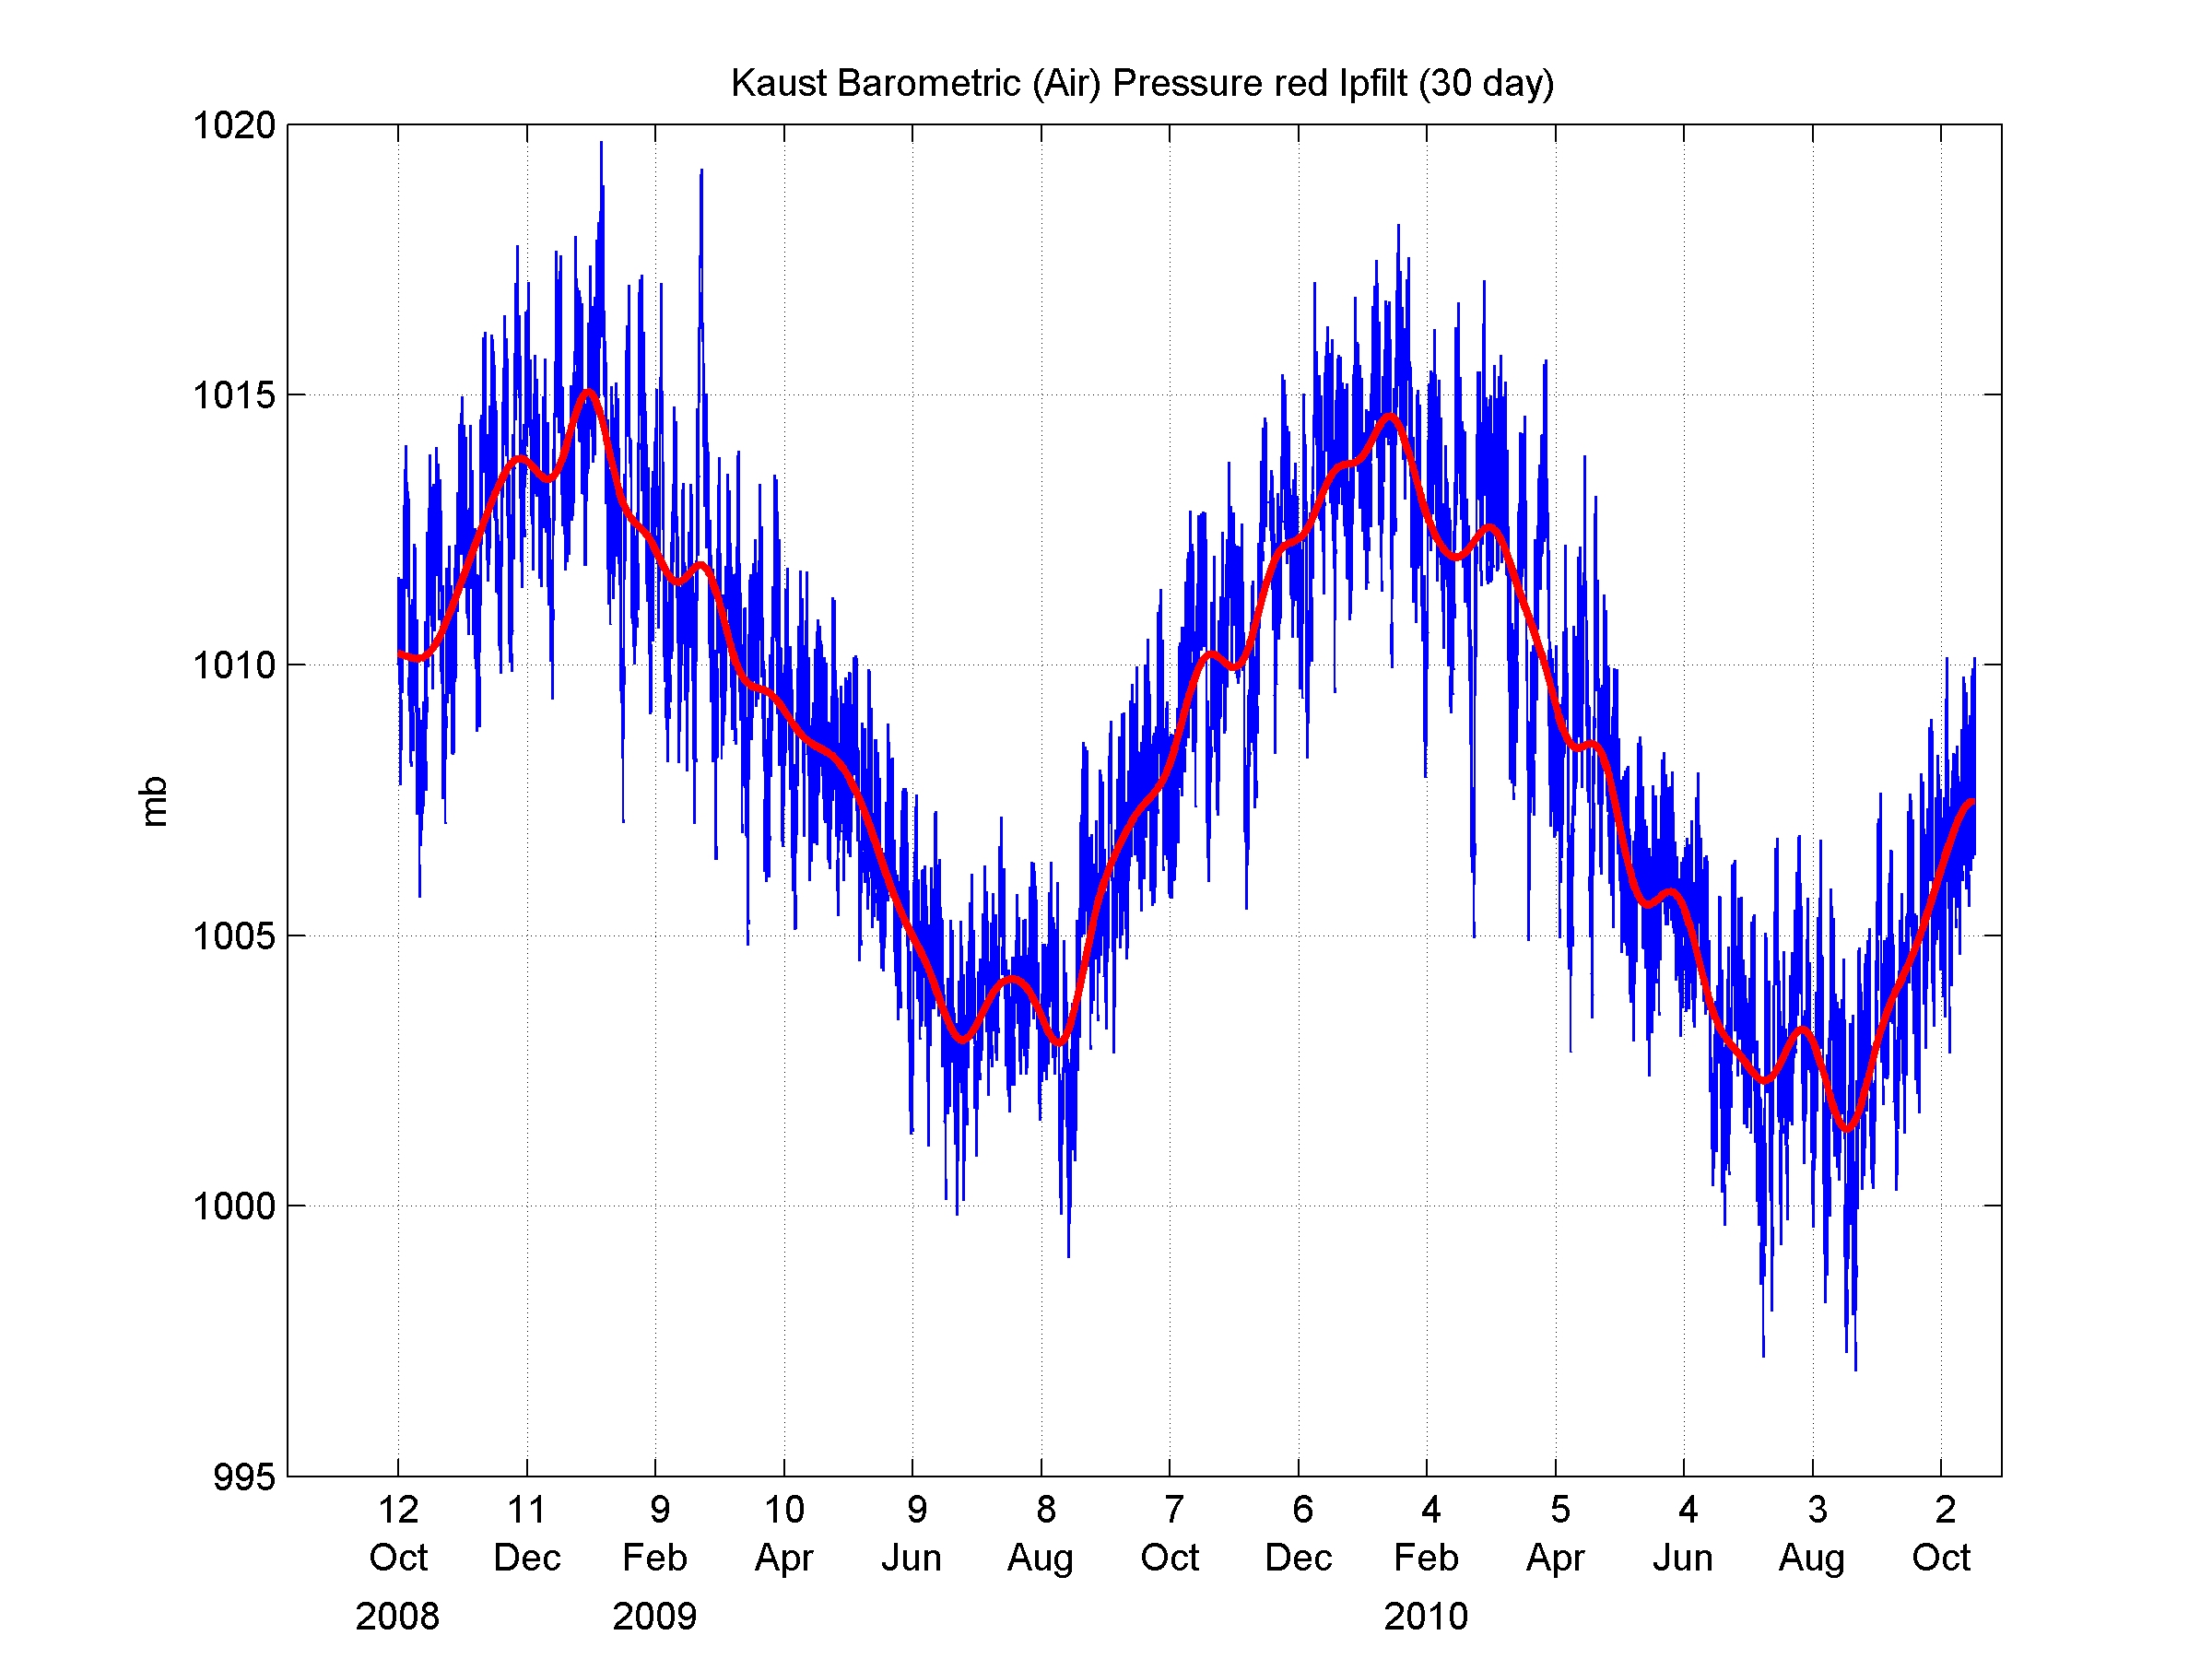 Figure 2. Barometric (air) pressure at Jeddah 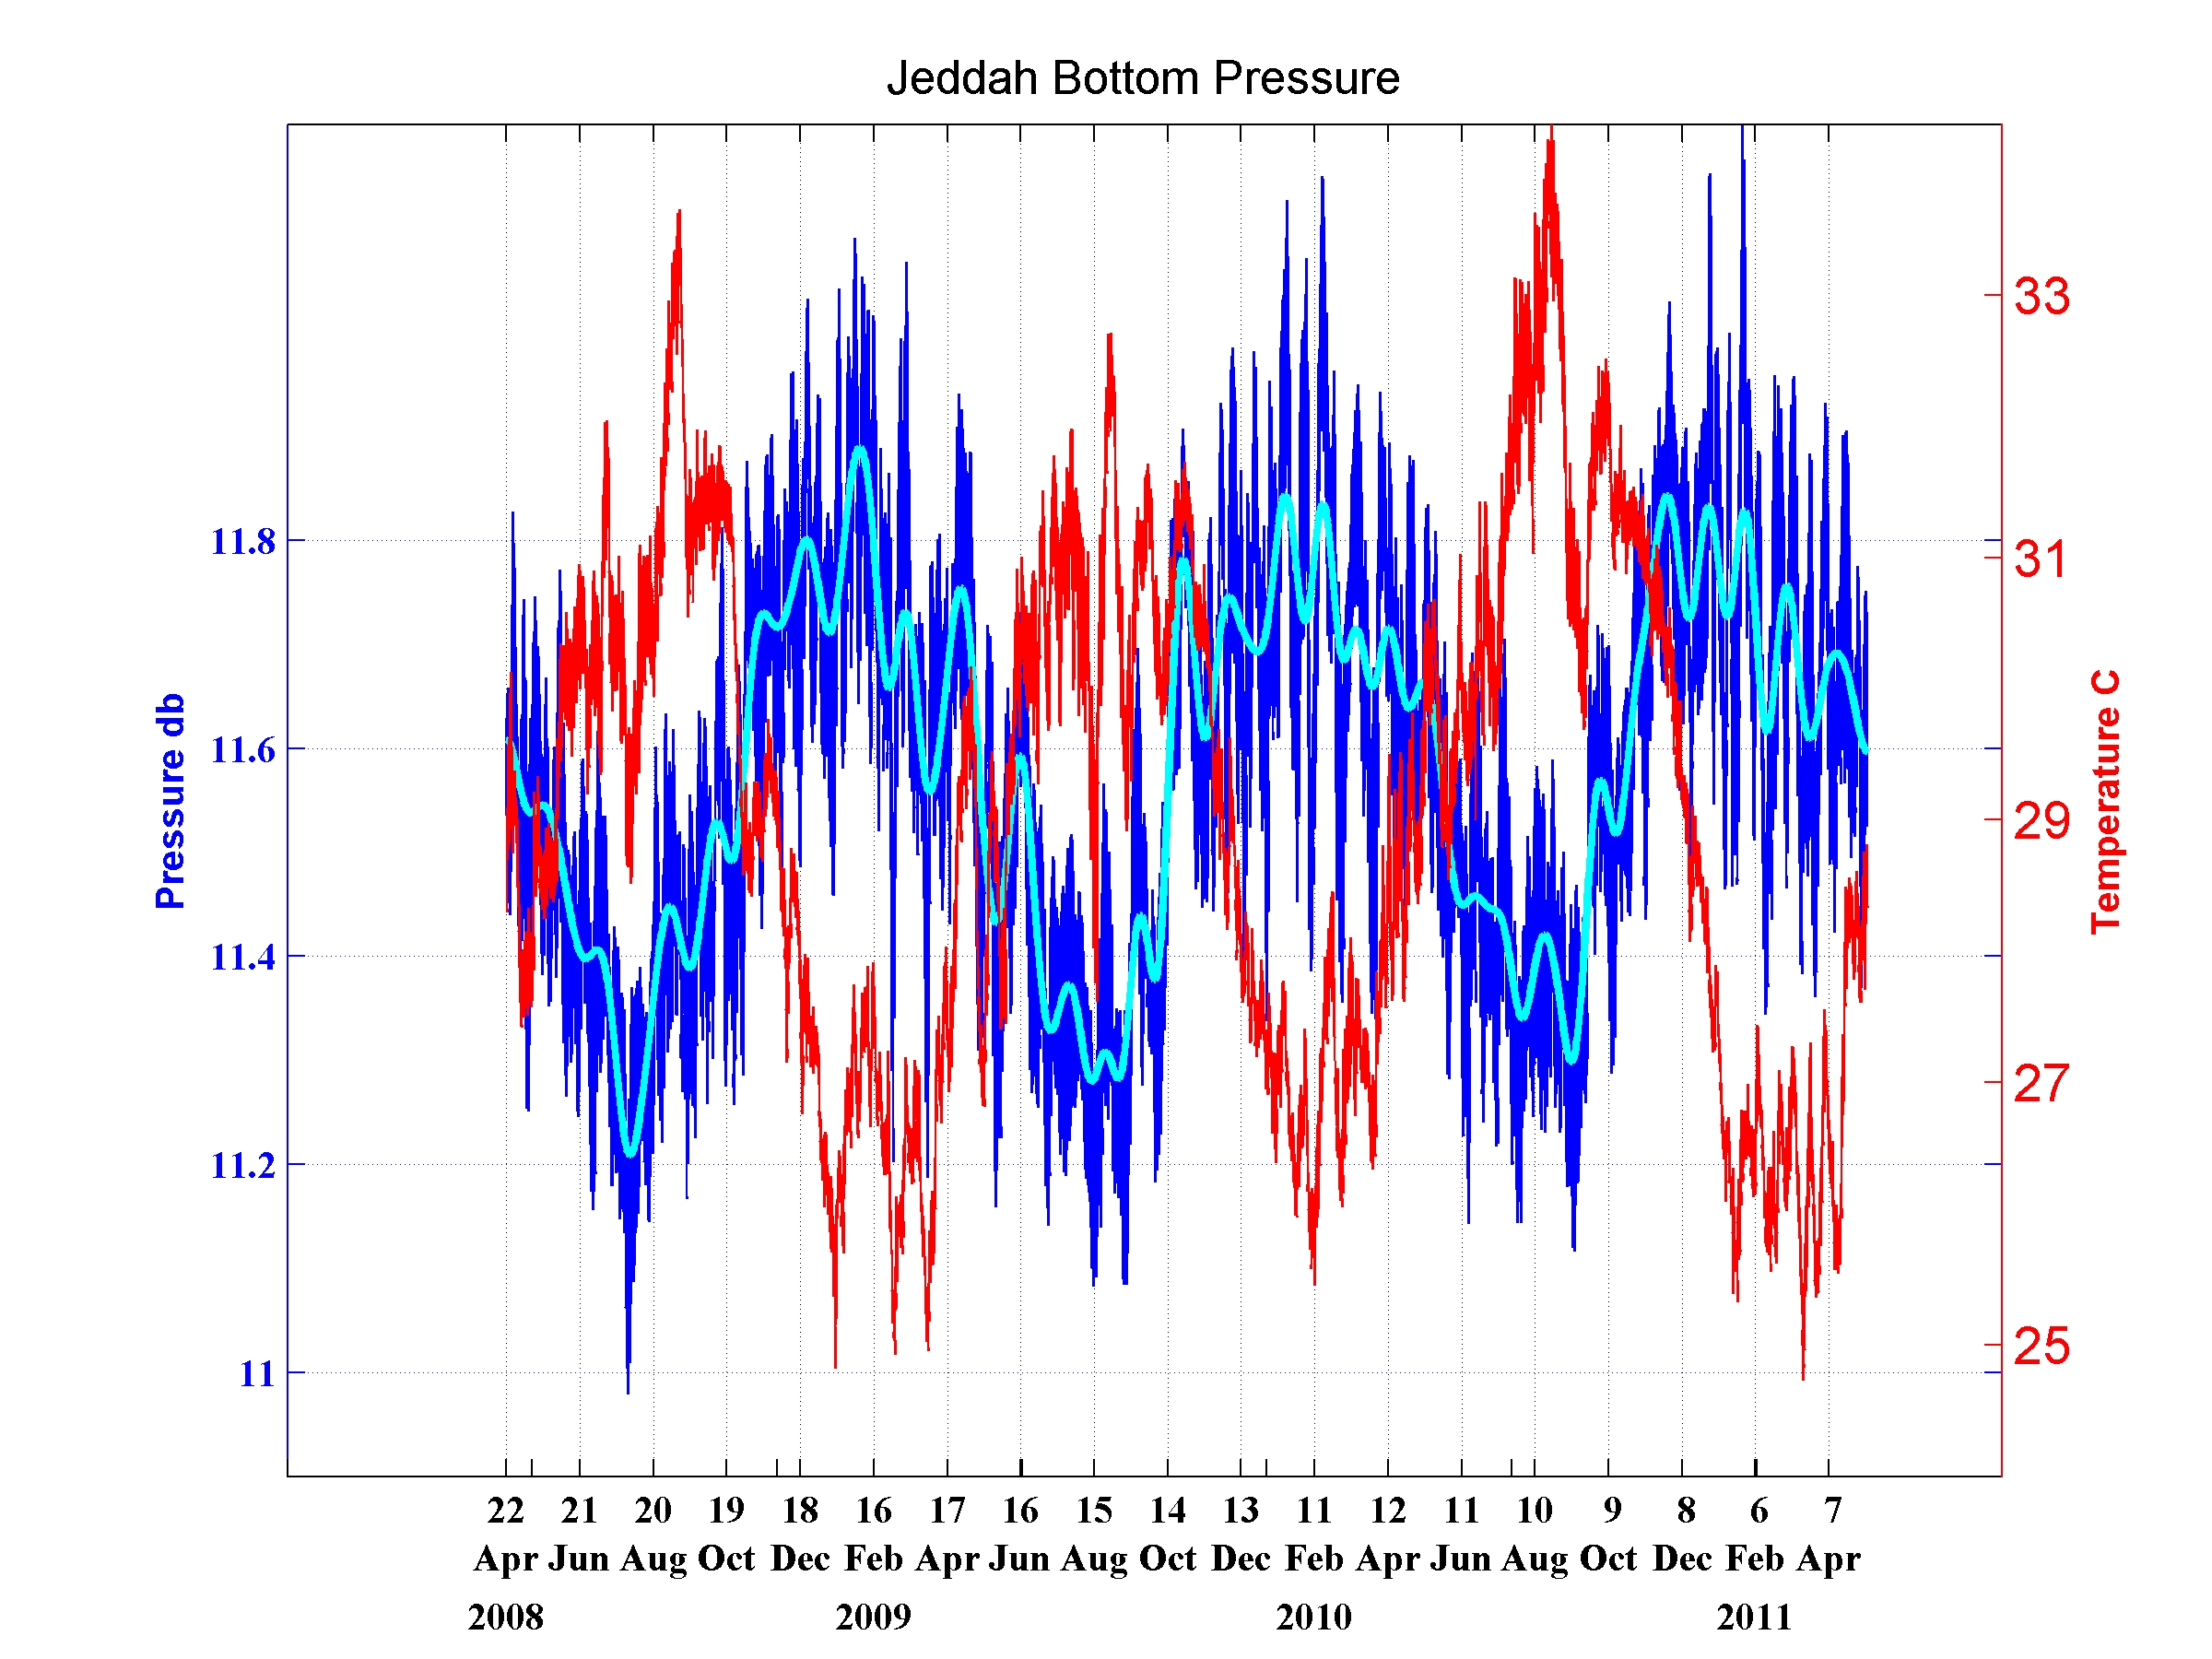 Figure 3. Merged Jeddah bottom pressure (blue), 30 day low pass filter pressure (cyan), surface temperature C (red). Sponsors This project was funded by King Abdullah University of Science and Technology (KAUST). Last updated: November 29, 2019 | |||||||||||||||||||
Copyright ©2007 Woods Hole Oceanographic Institution, All Rights Reserved, Privacy Policy. | |||||||||||||||||||