Tracer measurements
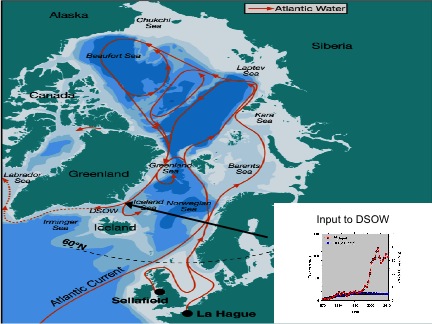
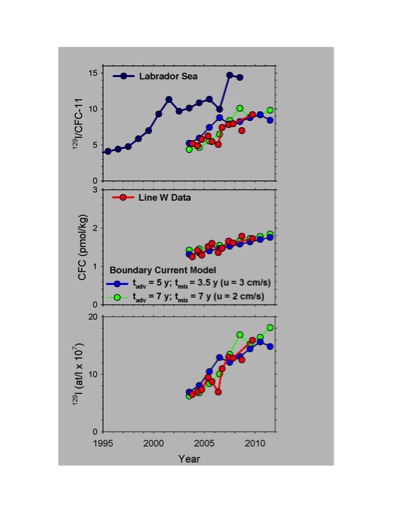
Tracer measurements on the Line W repeat hydrographic surveys include CFCs 11, 12 and 113, SF6 and I-129. The CFCs and SF6 enter the ocean from the atmosphere and provide a tag for the most recently ventilated waters. I-129 enters the eastern North Atlantic from European nuclear fuel reprocessing plants and is transported into the Arctic Ocean and the Nordic Seas where it becomes incorporated in DSOW. The tracer data are used to identify the most recently formed components of North Atlantic Deep Water, which are clearly visible as CFC maxima in the DWBC and in the interior, and to provide information on transit times for climate signals to propagate from the source regions of NADW to Line W. Variability in the properties of the DWBC cores of LSW and DSOW are investigated by averaging the temperature, salinity, and density and tracer concentrations for the tracer samples that comprise the cores. Transit times or propagation speeds can be estimated from the input histories of the various tracers. One example is the propagation of DSOW. We have used CFC-11 and I-129 data, which have different input functions (Fig.1), and fit the observations with a boundary current model that mixes laterally with the interior (Waugh and Hall, 2005). The best fit to the data yields a transit time of 5-7 years and a mixing time scale of 3.5-7 years (Fig. 2).