TOOLS OF THE OCEAN TRADE
September 26, 2013
Tweet
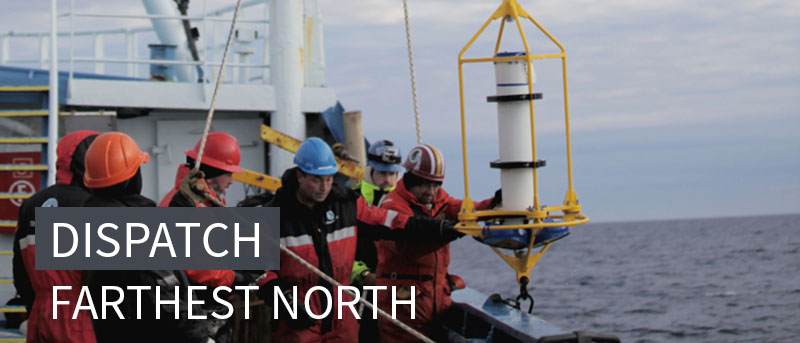
MicroCats, MMPs with ACMs, hardhat floats, a dual ORE acoustic release, both a Workhorse and Longranger ADCP, and a 17’ Benthos XT-6000. Those are a few of the tools I heard people talking about at breakfast, and if we jumped this and joined another research vessel in the other hemisphere, we’d hear similar talk at lunch. Of course, all specialties, scientific and otherwise, need their own language, and casually drop jargon impenetrable to the uninitiated. But for present purposes, we don’t need a welter of words to appreciate what’s going on out here, only the concept that measuring oceans—the movement of the water itself—is an esoteric act requiring specialized and creative tools. However, there remains one particular tool we can’t ignore, not only because it’s fundamental to oceanography, but because it’s presently turning up some evocative and tantalizing data about the behavior of water: the CTD.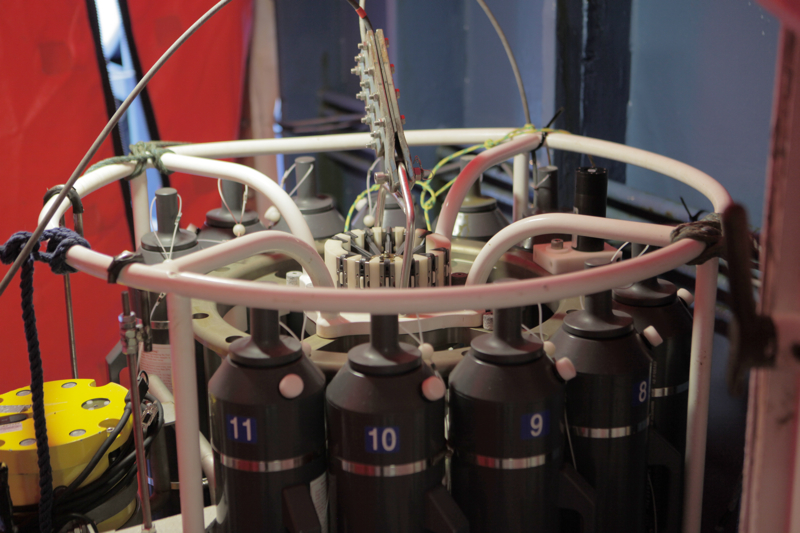
It stands for Conductivity-Temperature-Depth. By measuring conductivity and applying an algorithm or two, you can determine salinity. Temperature and depth are pretty straightforward. By gleaning all three, you can identify the water’s fingerprint, situate it in the water column, and thereby explicate the current in question. The device itself, often weighing in at about one ton, often called the “package,” consists most conspiculously of a set of water sampling bottles, like thin scuba tanks, mounted on a circular metal frame. (Let’s let Amy’s photos further describe the instrument itself.) Sensors mounted beneath the bottles not only measure salinity, temperature, and depth, but transmit that data in real time through specialized oceanographic wire to a dedicated “acquisition” computer. Bolt an ADCP on the package and you can record the velocity of the current, thereby gaining knowledge about its volumetric transport. All three are vital.
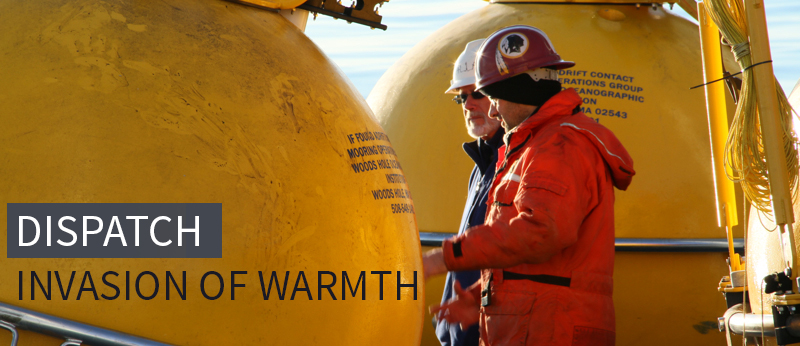
Moorings, you may recall, do the same thing. Their advantage is that, since they remain submerged gathering and storing data for a year or more, they can address the constant variability inherent to ocean motion. On the flip side, that’s also their disadvantage—they’re stationary, able only to measure the water passing the particular site where they’ve been anchored. The CTD is portable. By lowering it through the water column, the scientist can gain a vertical picture of the water anywhere he or she wants. That’s also its disadvantage; it provides only a snapshot measurement of temperature, salinity (T/S) and velocity at that particular place and point in time. But to use both the CTD and a string of moorings in conjunction provides a more categorical measurement of ocean motion in the study area.
 On Lance, the CTD is housed in a red tent on the portside near the foredeck. Two two-person watches deploy the package (one watch consists of Bob’s guest student from Russia, Maria, and his son Matt) usually at night when mooring operations aren’t going on. The operators wheel it from under its protective tent and lower it on a winch to within a few meters of the bottom. (Don’t hit the bottom, for God’s sake!) The operators know where bottom is because it’s been surveyed by sonar to produce the ocean version of a topographical map, but as backup protection, the package carries a down-looking altimeter. The more CTD casts you can perform in a line across a given area of ocean, the tighter the “resolution” and, therefore, the more accurate a picture of the ocean’s behavior you receive. (During last year’s expedition in the waters between Iceland and northeast Greenland, Bob’s operators lowered and raised the package, along a series of lines, 335 times—that’s resolution.)
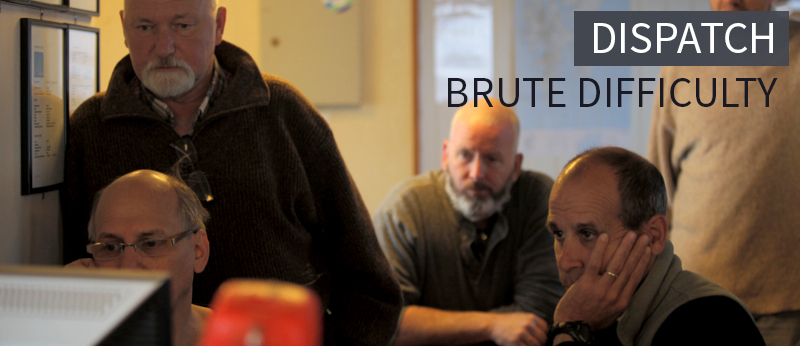
To repeat, the purpose of this expedition is to measure the quantity of warm Atlantic water entering the Arctic Ocean through the Fram Strait and to begin to learn how that water spreads into the central basin. We also noted that currents tend to hug the edges of ocean basins, and some do so in an ordered, disciplined manner as if through a hose. Apparently, this one does not. Yesterday Bob showed me a series of graphic representations of the water column produced from the raw CTD via a specialized computer program called MatLab. They suggested that the current is surprisingly turbulent, indicating perhaps separate pulses of warm water.
“What does it mean?” I asked, even as I knew it was a premature question.
"Eureka moments are rare in physical oceanography; the ocean’s too complex and variable for that."
“I don’t know yet,” he predictably answered. “But maybe these pulses trigger a release of warm water into the interior.” Maybe something else does. Or maybe something else in partnership with the pulses. Anyway, he spends over twelve hours a days peering at MatLab graphics and raw CTD on his computer screen delving into the question. Eureka moments are rare in physical oceanography; the ocean’s too complex and variable for that. The last mooring was redeployed this morning, and now it’s to be one CTD cast after another for the next several days until time runs out and we turn for Tromsø. Maybe the Arctic Ocean will relinquish its secrets after we parse the numerous gigabytes of CTD and mooring data. Maybe not. The ocean goes about its business according to the physical forces that influence it. Scientists, with their ships and expensive, esoteric gear can only scurry along after it, measuring, plumbing its depths, pondering. But someday, maybe sooner than later, they’ll understand how all that water from the tropical Atlantic floods the frigid Arctic basin—and how, doing so, it shapes elements of our climate.
-Dallas Murphy