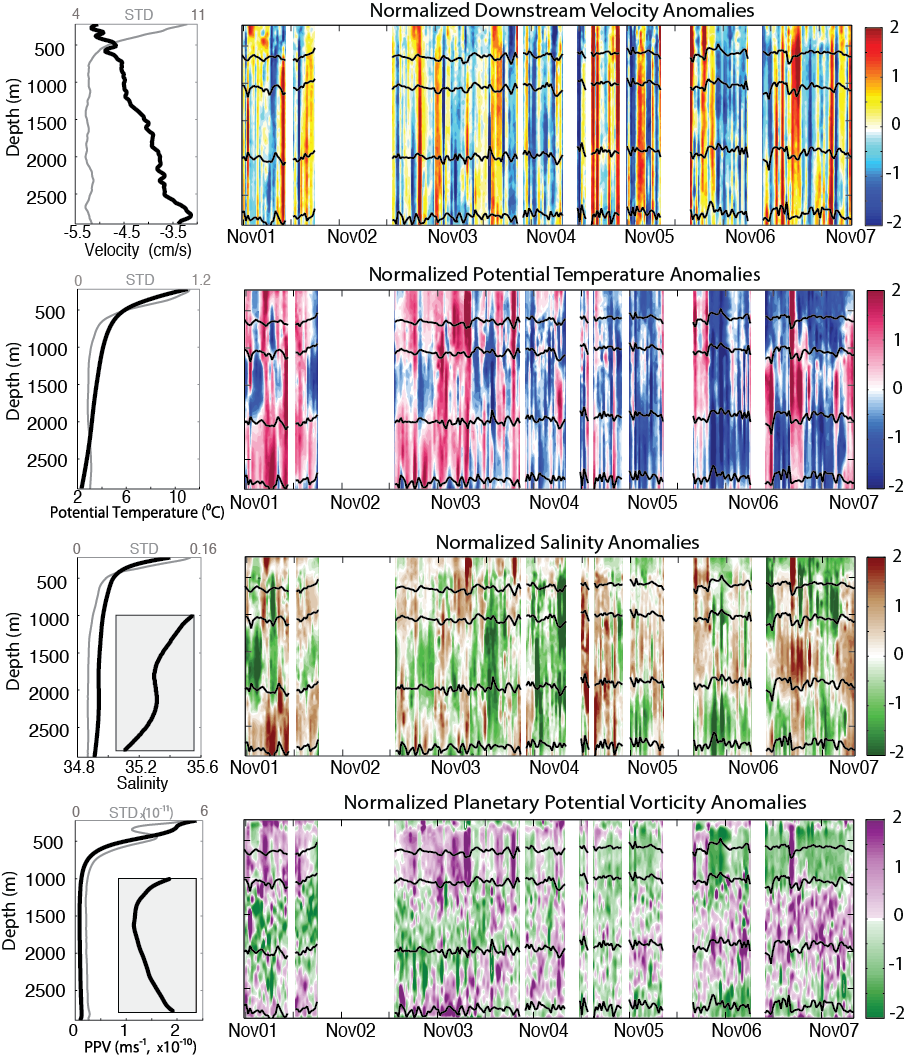
This figure, from Pena-Molino et al. 2011, shows normalized time series of temperature, salinity and PV from the central mooring on Line W (W3). Neutral density surfaces bounding the 4 layers are black lines on the color maps. The leftmost panels give the mean property profile (thick black line) and standard deviation (thin gray line) from which the anomalies were derived. A blow-up of the bottom 2000 meters of mean salinity and PV is provided in the shaded box to highlight the minima in these properties associated with the LSW layers.