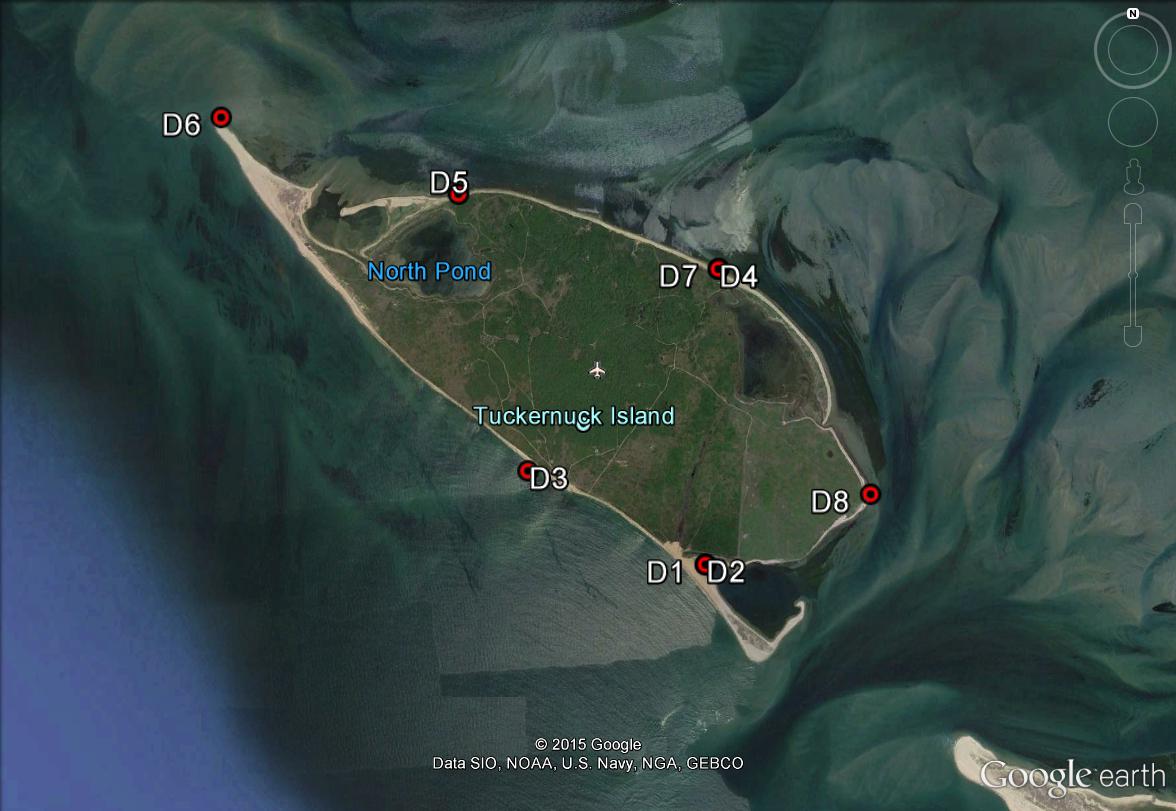
The 8 bottom pressure deployment locations are shown above.
2013 Tuckernuck pressure data, documentation, and plots in file Tuckernuck_Pressure_Data_2013.zip
Mfiles to read/plot pressure data in file Tuckernuck_Pressure_Mfiles_2013.zip
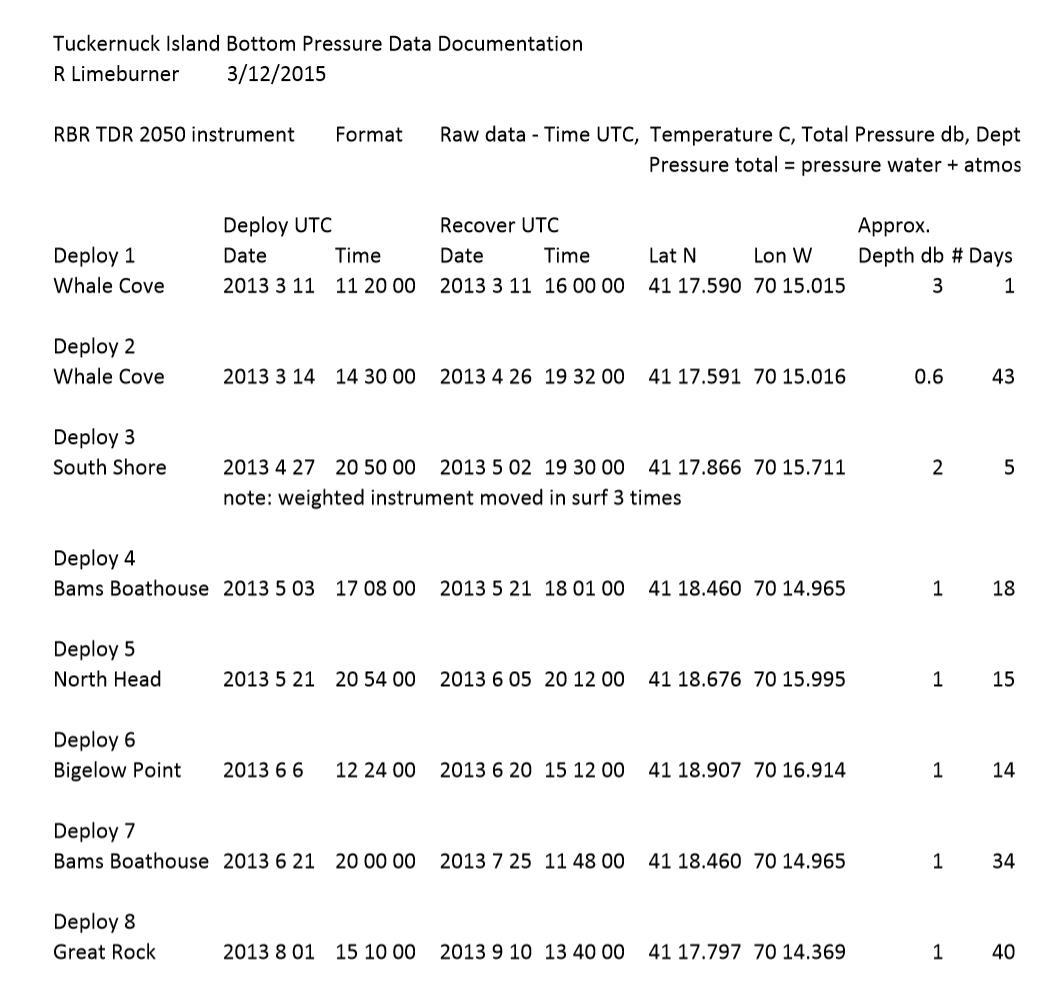
Deployment times and locations are shown below and in file Pressure Deploment Table
1) The raw ascii data including before and after the time in water, time is UTC, pressure db total= air + atmosphere
2) Simple plots of raw water pressure data have atmosphere pressure removed.
3) The red line in the plots is a low pass filter with 33hr half width.
4) Raw Data Format - Time Yr Mon Day Hr Min Sec UTC, Temperature C, Total Pressure db, Depth db, see data documentation above
5) Tuckernuck_Pressure_Mfiles.zip are 8 mfiles to read the 8 raw data files and delete the data before and after deployment, time is UTC.