| Overview | |
| Science | |
| Data | |
| Data | |
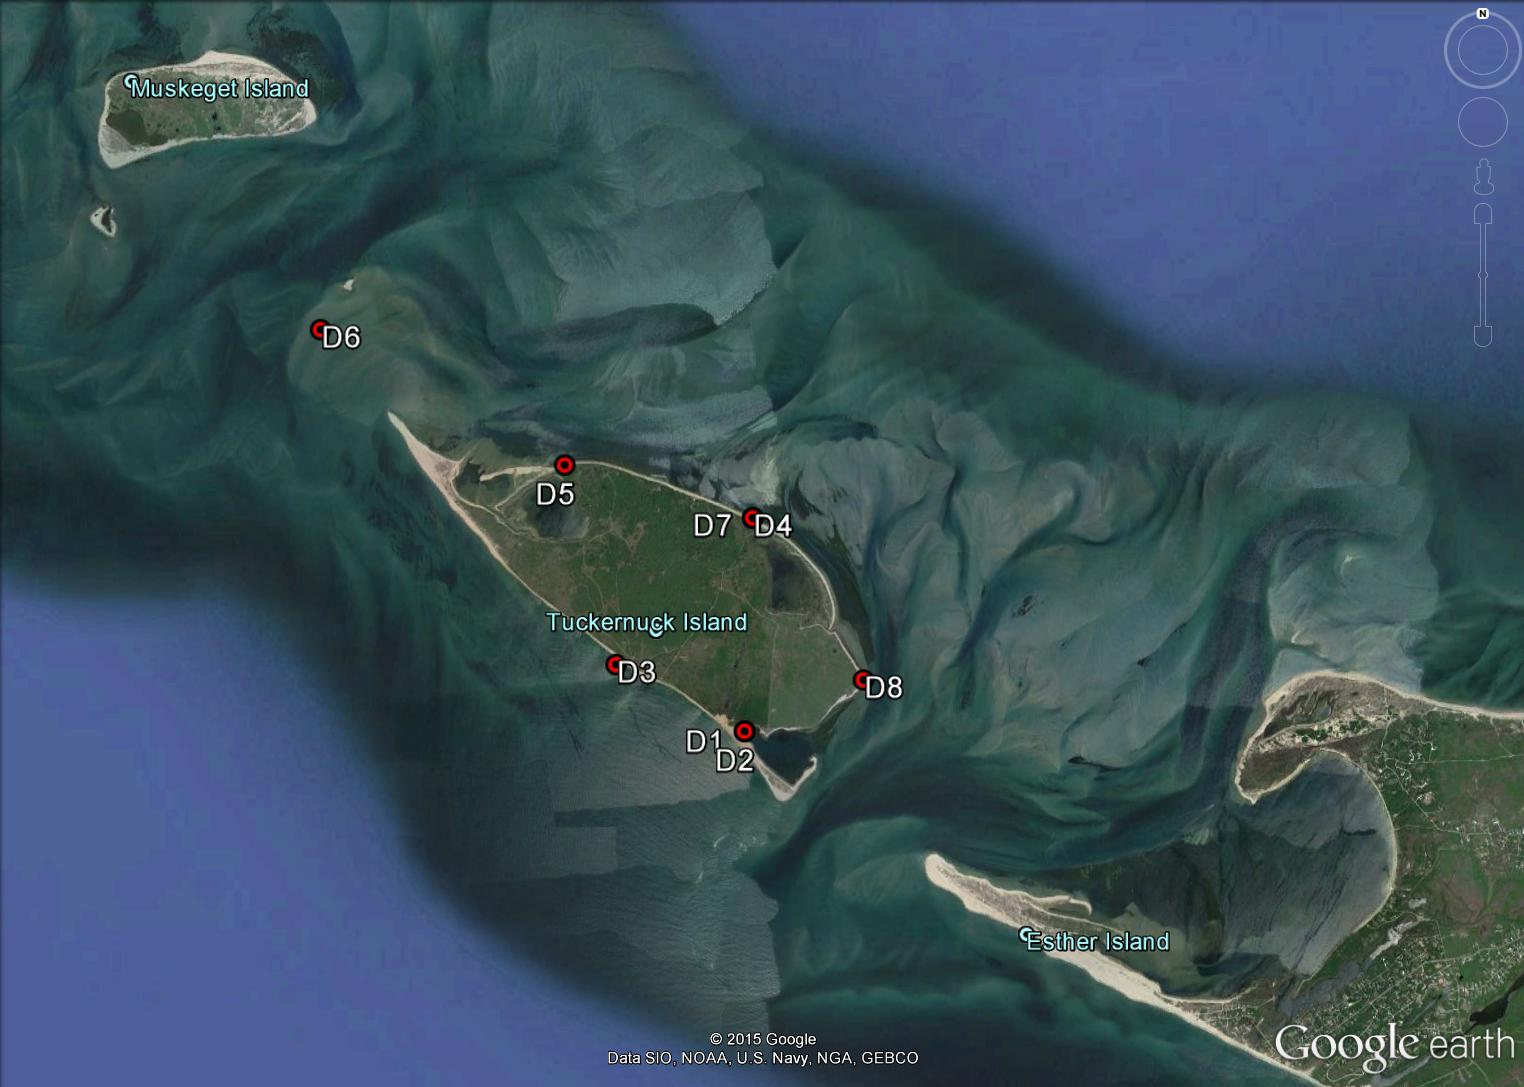
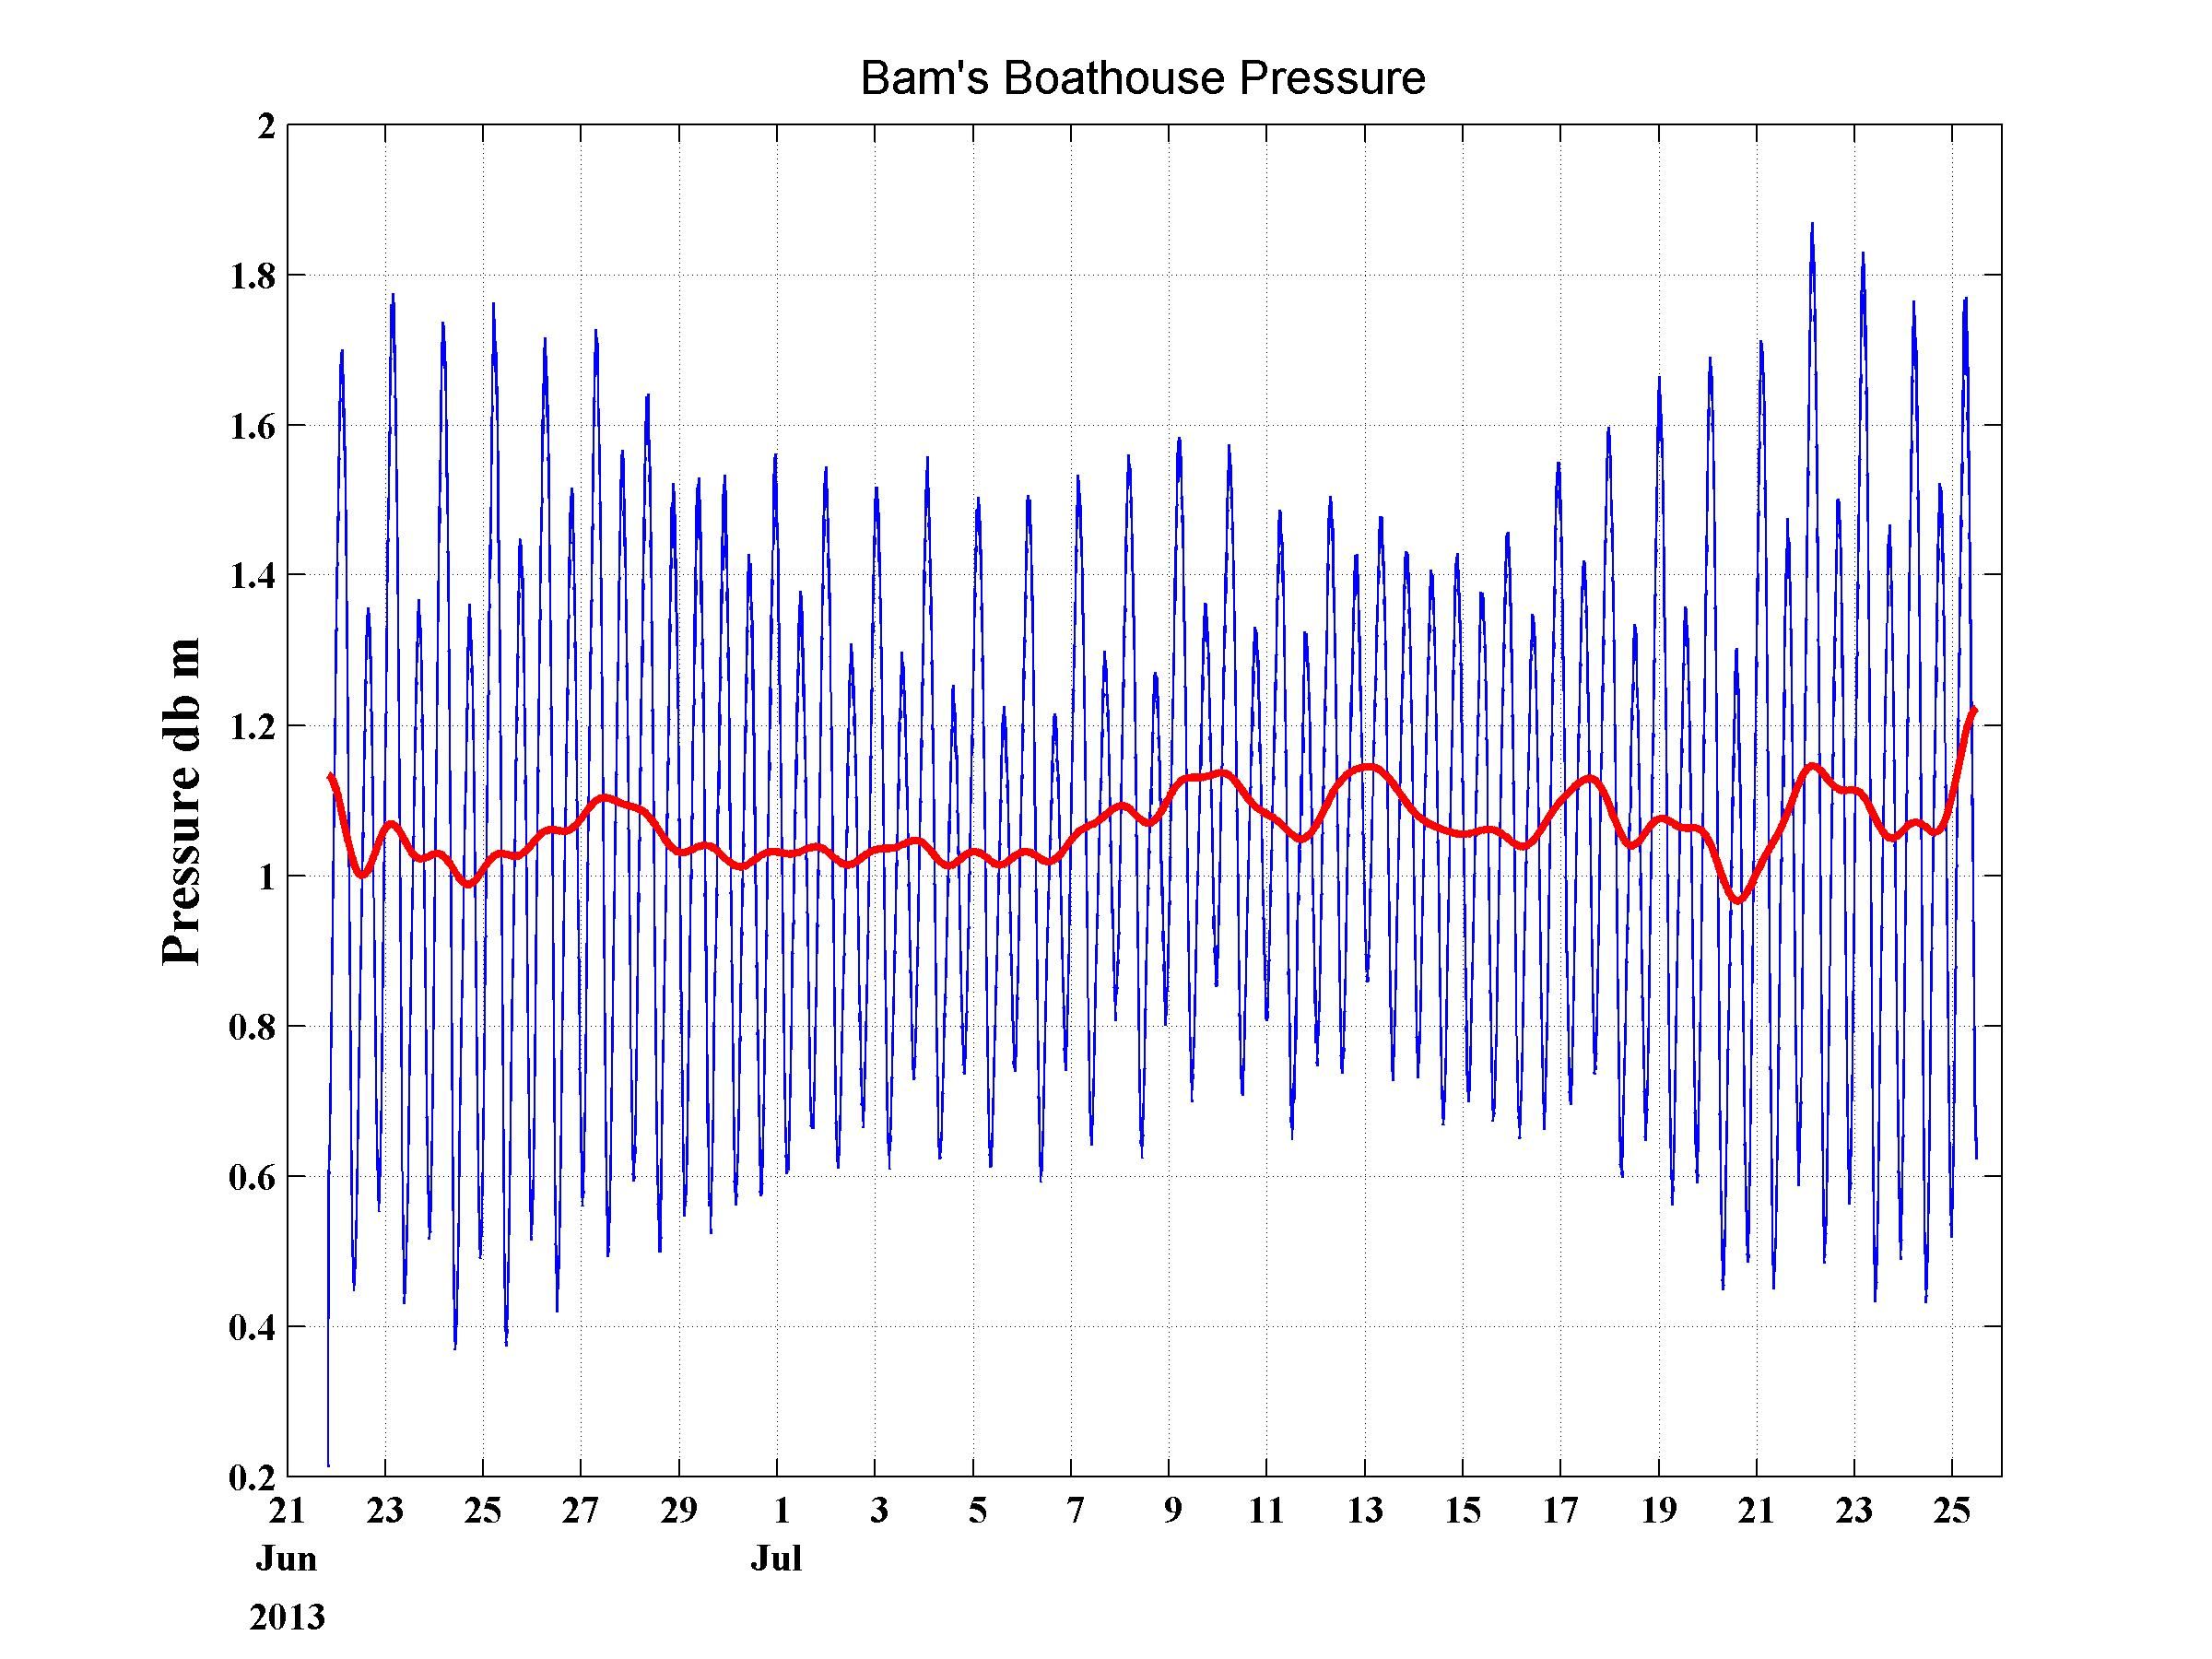
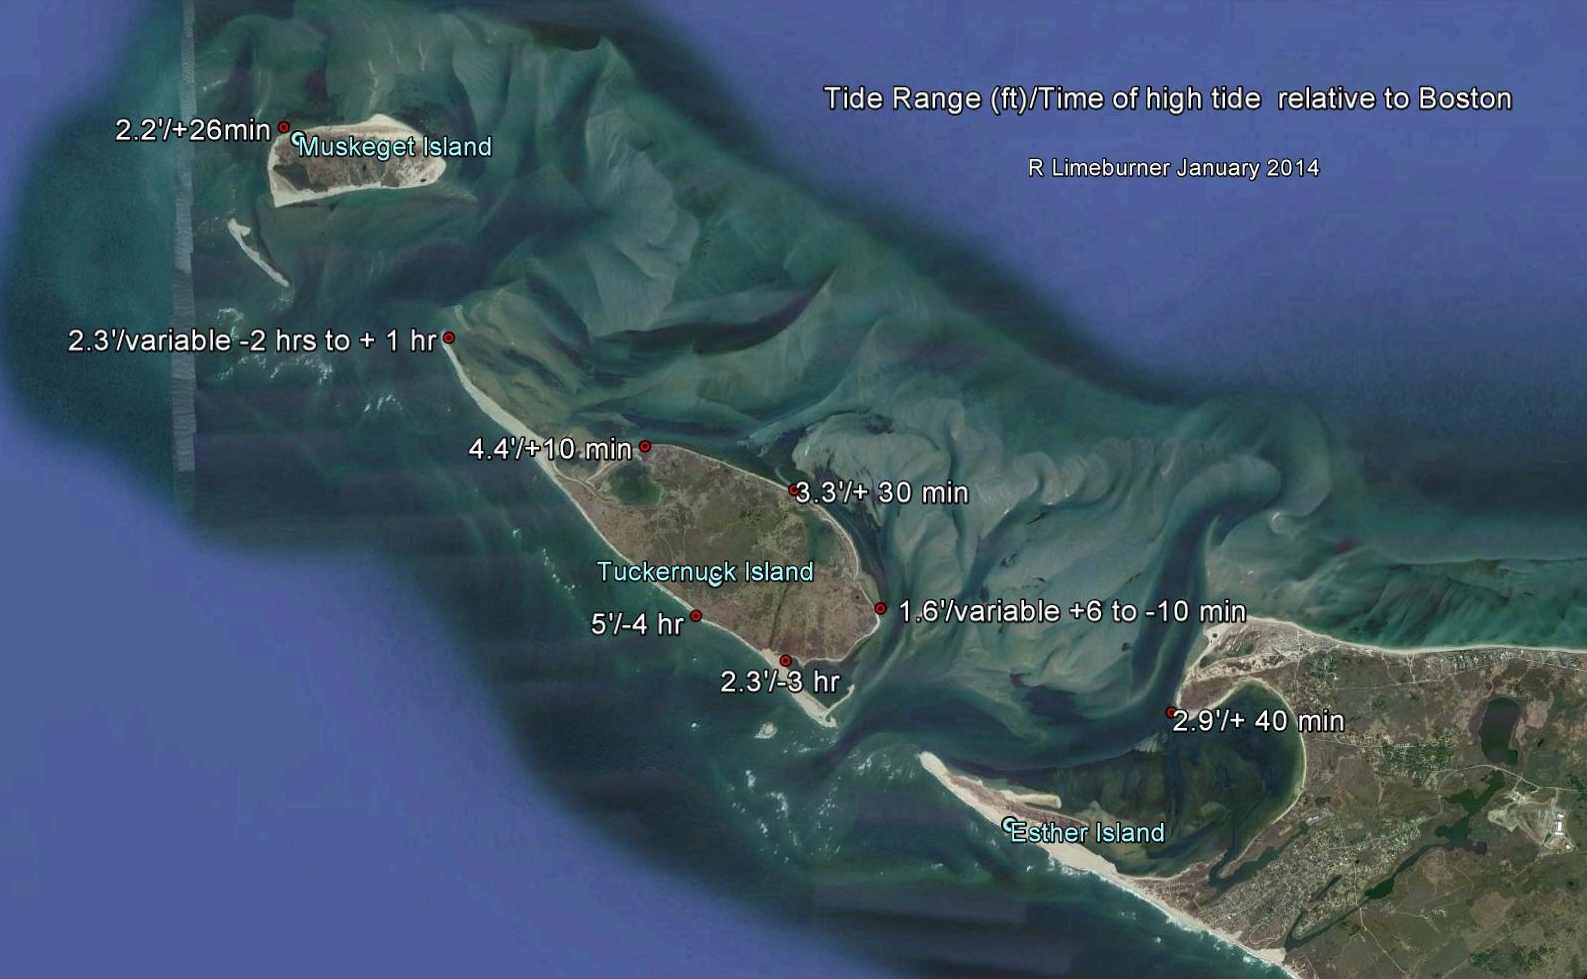
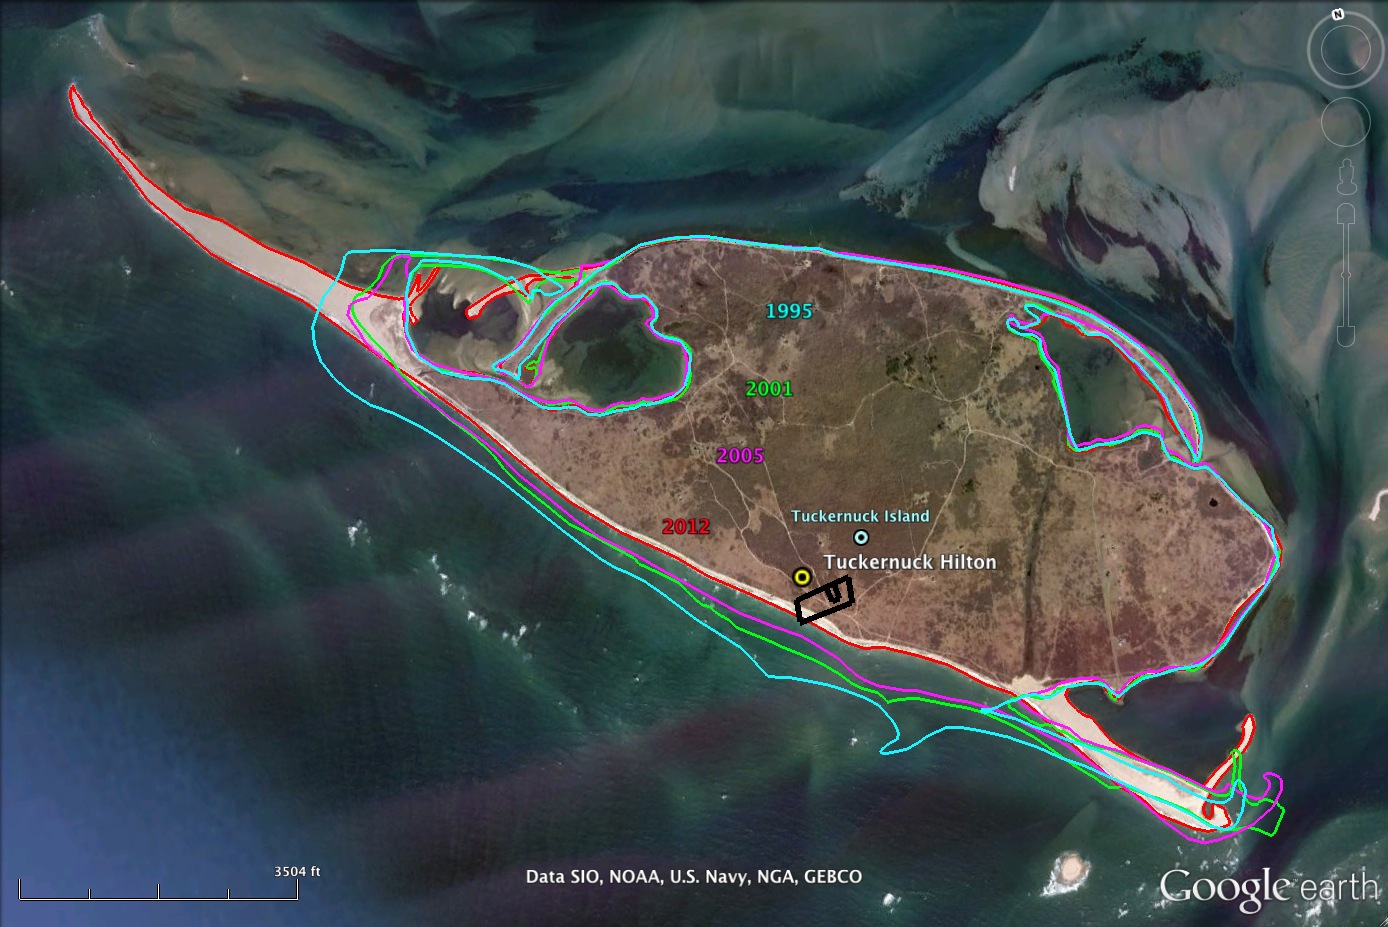
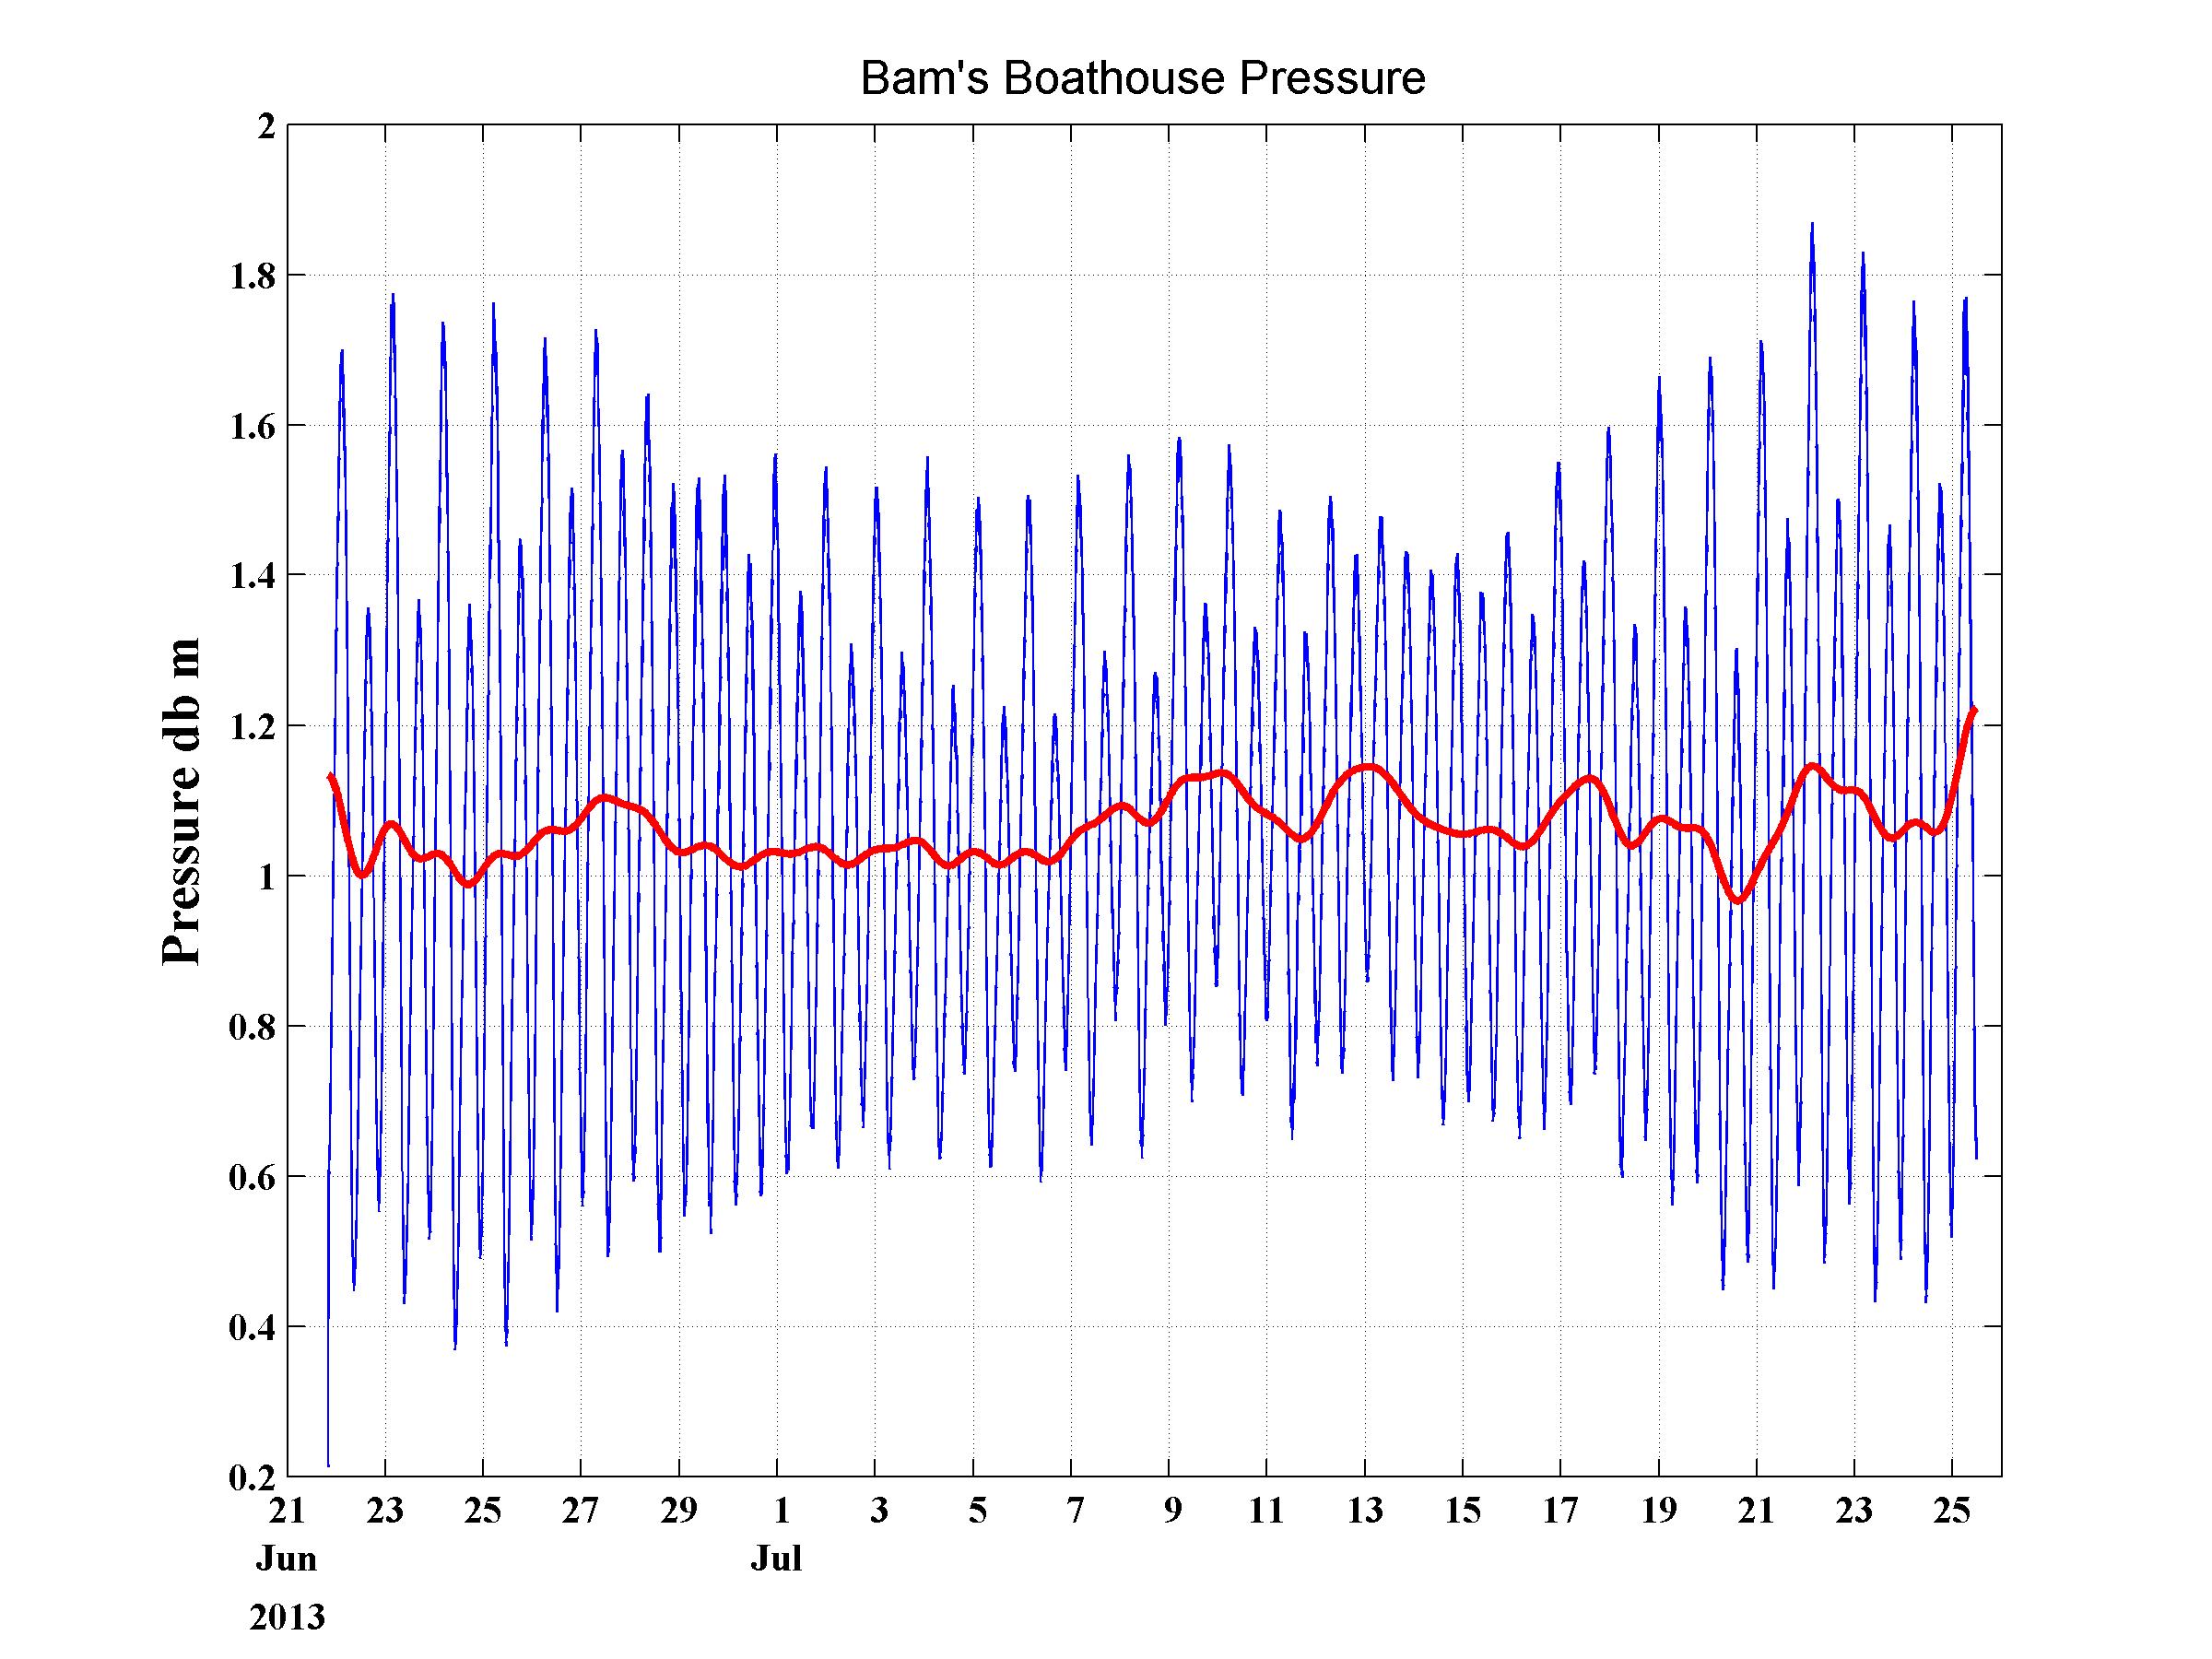
Tuckernuck Island is located along the Massachusetts coast between Nantucket and Marthas Vineyard Islands and is surrounded by shifting shallow sand shoals. North of Tuckernuck is Nantucket Sound and south of Tuckernuck is the Atlantic Ocean. The coastline of Tuckernuck is constantly eroding or acreting due to winds, waves, and variations in sea level. Tidal elevations around Tuckernuck Island had not been measured prior to 2013, but local knowledge indicated the tide was greater and earlier on the south shore. This report documents 8 deployments of tide gauges around Tuckernuck Island during 2013 and archives the data. Tuckernuck Island Bottom Pressure Data Moored measurements of bottom pressure and temperature were made along the coast of Tuckernuck Island during 2013. An RBR TDR 2050 serial number 016188 pressure/temperature recorder was deployed on a 1 m steel auger screwed into the bottom at 8 locations (Figure 1). Accuracy was estimated to be a few millimeters. Sea level pressure above the instrument was calculated from the pressure data by first removing the pressure of the atmosphere and then dividing by gravity and seawater density (Figure 2). Figure 2 shows the bottom pressure data at one location on the north shore of Tuckernuck Island. The solid red line is low pass filtered data with a 33 hr cutoff. Figure 3 summarizes the tidal elevation results. The tidal range is the maximum variation of the sea level over 12.4 hours and the phase is the time (hours minutes) of any one high or low tide relative to Boston on average. The range is greatest (5') on the south shore of Tuckernuck in front of the Tuckernuck airport built by W. Clement and the phase relative to Boston is earliest on the south shore as well (-4 hours relative to Boston). The tidal elevation phase on the south shore of Tuckernuck Island is 4.5 hours earlier than the phase on the north shore. Whale Cove has a range of 2.3' and the phase is 3 hours earlier than Boston. The tidal phase along the north shore from Bam La Farge's boathouse to the North Head house is only a few minutes after Boston. The tidal elevation chacteristics in Nantucket Sound and on the shelf south of Tuckernuck Island are vary different in amplitude and phase and these differences are most complicated as is evident in the shallow gaps between the islands. A more detailed report of the tidal variability is being written and will be available here shortly. Tuckernuck Island Erosion The coasts of Tuckernuck, Muskeget and Nantucket Islands have been changing since the glaciers first formed the islands a few thousand years ago. The coastline of Tuckernuck Island during 1995, 2001, 2005 and 2012 was plotted over a 2012 Google Earth aerial photograph shown in Figure 2. . Major erosion and deposition occurred over the 17 year period since 1995 at the east and west ends of the island and along the south coast (approximately 42 feet/year on average), but relatively little changes occurred along the north shore until 2013. Whale Cove in the southeast corner of the island appears to be migrating toward the east. Bigelow Point at the western end of the island has eroded 1 km since 2012 image in Figure 4. Changes in the coastline at the eastern and western ends of the island are assumed to locally affect the tidal variability. To see the complete erosion report click here. |