|
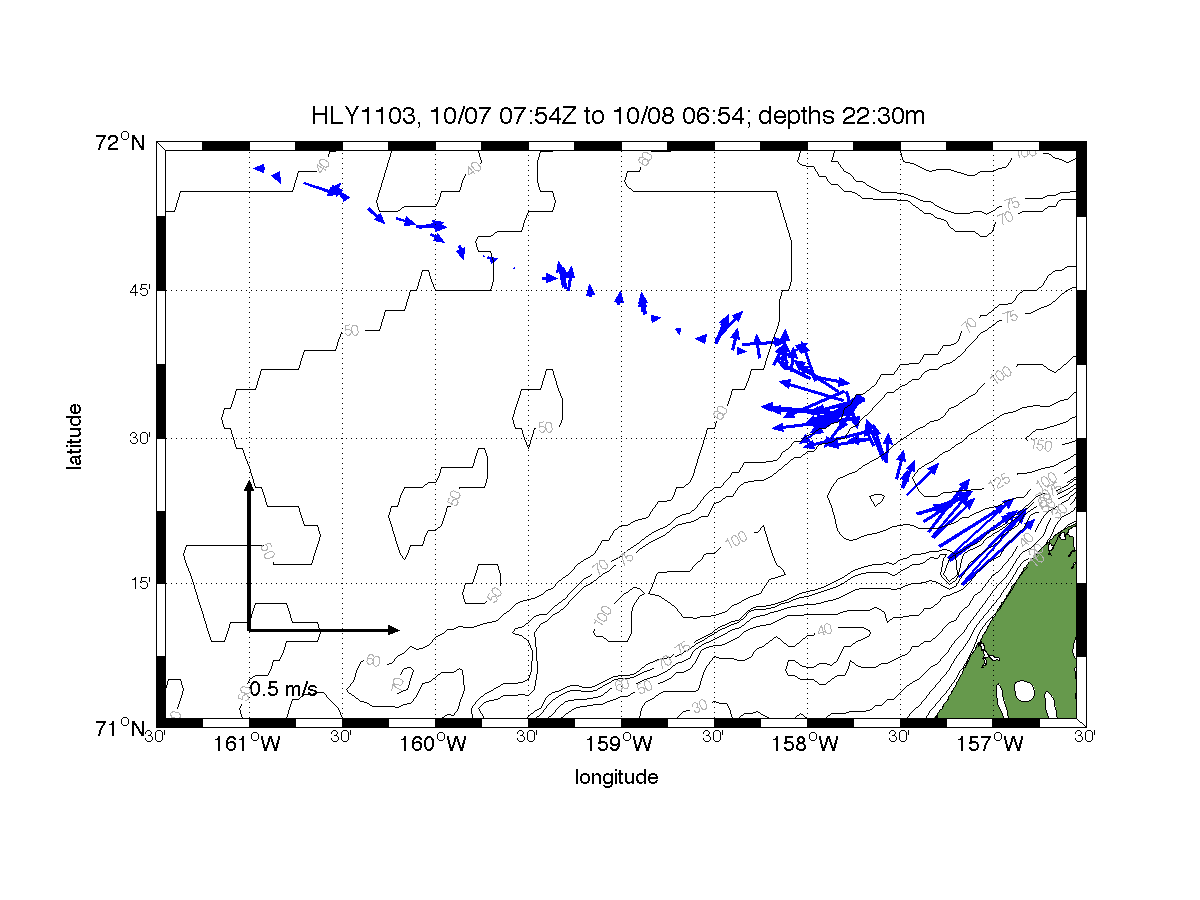
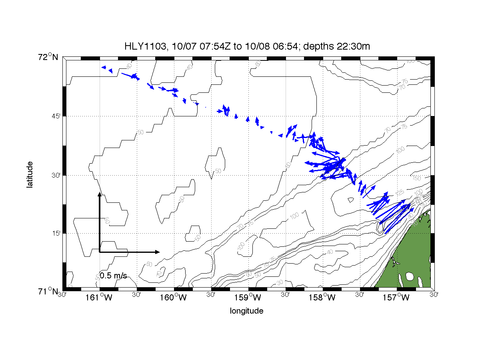
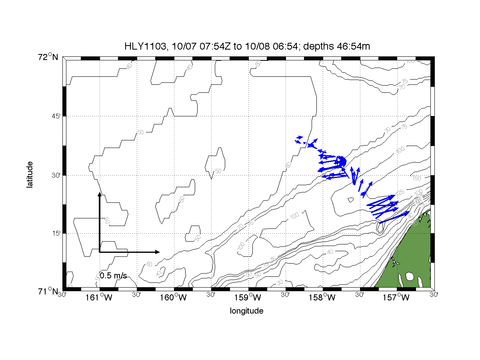
The following plots were derived from the 5-minute averaged files
generated by the OS150 using NB profiling, 4m bins, 5m blanking.
For the vector plots, two 5-minute ensembles were averaged in time
and over the vertical range indicated in the plot title (the numbers
indicate the bin center depths).
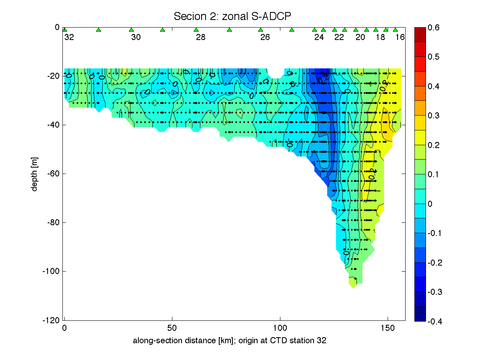
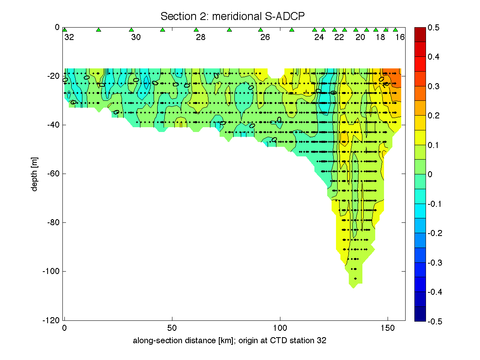
For the contour plots, the ADCP data were first projected onto
an idealized CTD line, derived by least-squares fitting a straight line
to the positions of the ADCP profiles collected during the CTD section.
The section start- and end points were defined by the locations for the
CTD stations 16 through 32, with the location of station 16 at the south-eastern
(inshore) end defining the distance origin.
The first set of contour plots show zonal (positive eastward) and
meridional (positive northward):
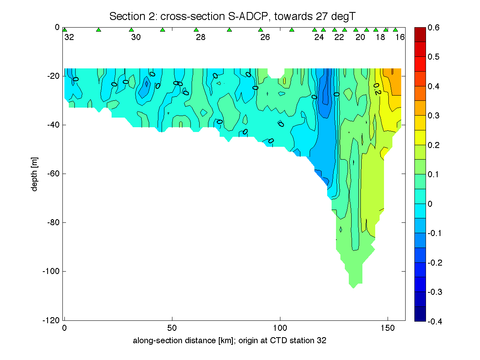
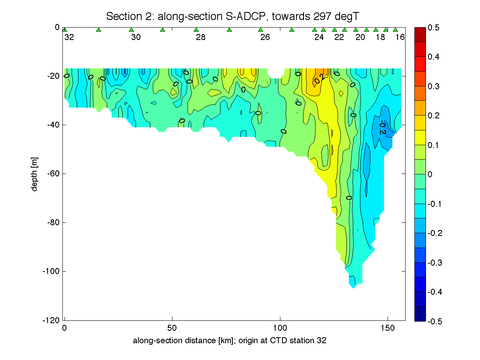
The second set of contour plots show the cross-section and along-section
velocity components.
|