Data from ITP110
Last surface buoy status
| Time (UTC) |
2024-10-20 06:03:27 |
| Latitude |
70.12033 |
| Longitude |
-130.40747 |
| temperature (deg C) |
-0.2500 |
| battery voltage |
10.182 |
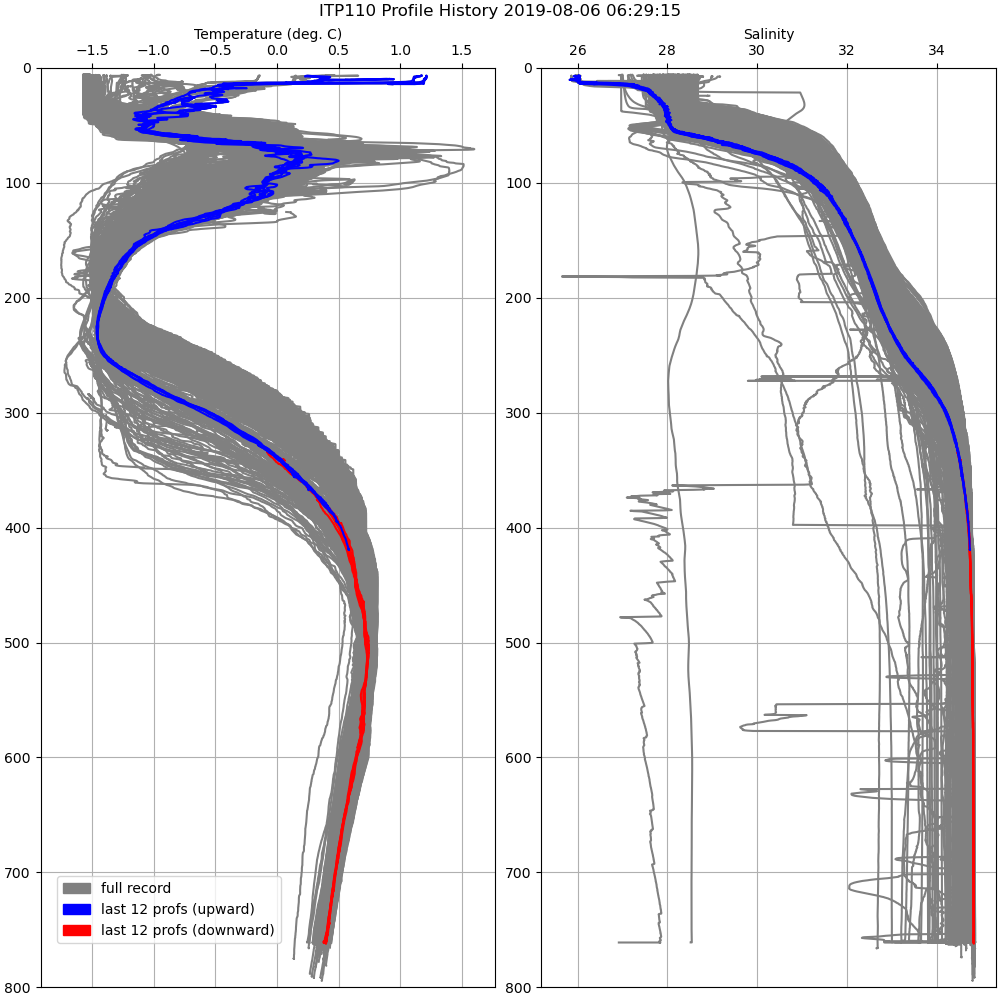
Last profile statistics
| Last profile number |
640 |
| Profile Time (UTC) |
2019-08-06 06:00:02 |
| mean motor current (mA) |
133.590 |
| mean battery voltage |
10.800 |
| minimum pressure (dbar) |
375.360 |
| maximum pressure (dbar) |
761.400 |
| minimum temperature (C) |
0.322 |
| maximum temperature (C) |
0.730 |
| minimum salinity (PSU) |
34.637 |
| maximum salinity (PSU) |
34.831 |
| minimum oxygen (μmol/kg) |
1.467 |
| maximum oxygen (μmol/kg) |
367.599 |
Description
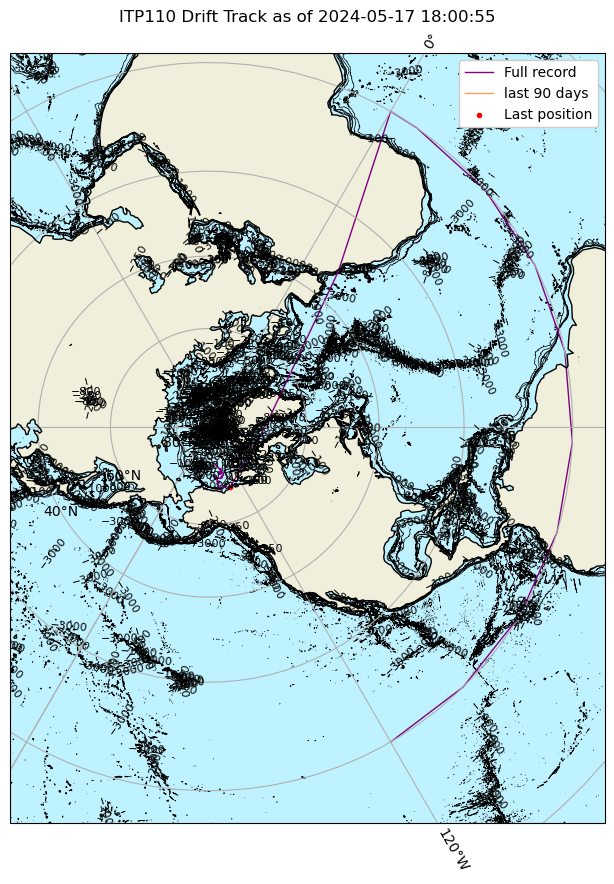
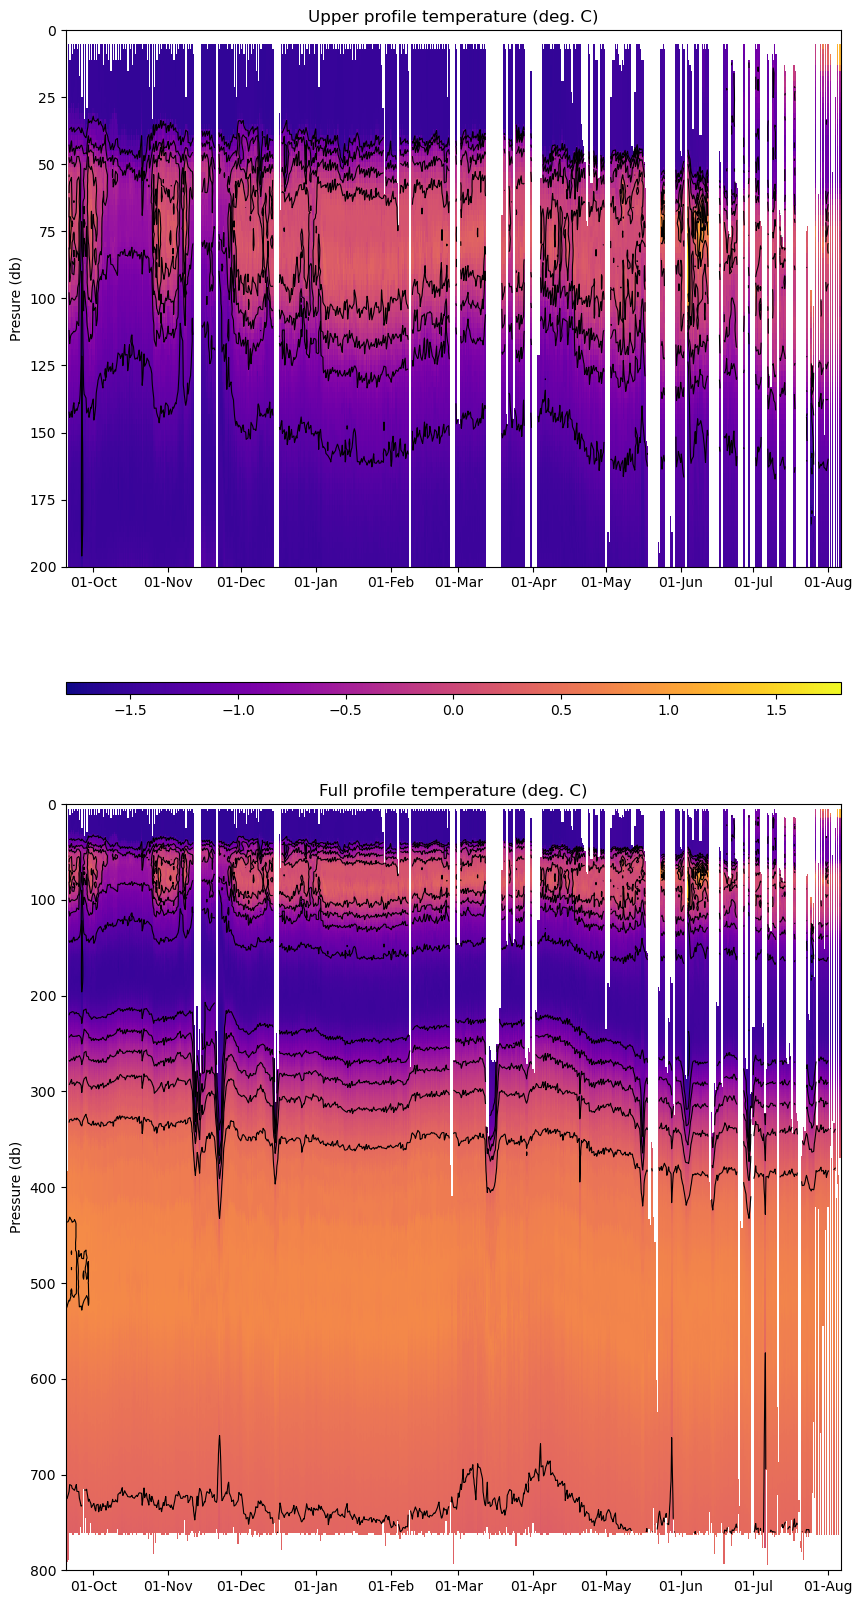
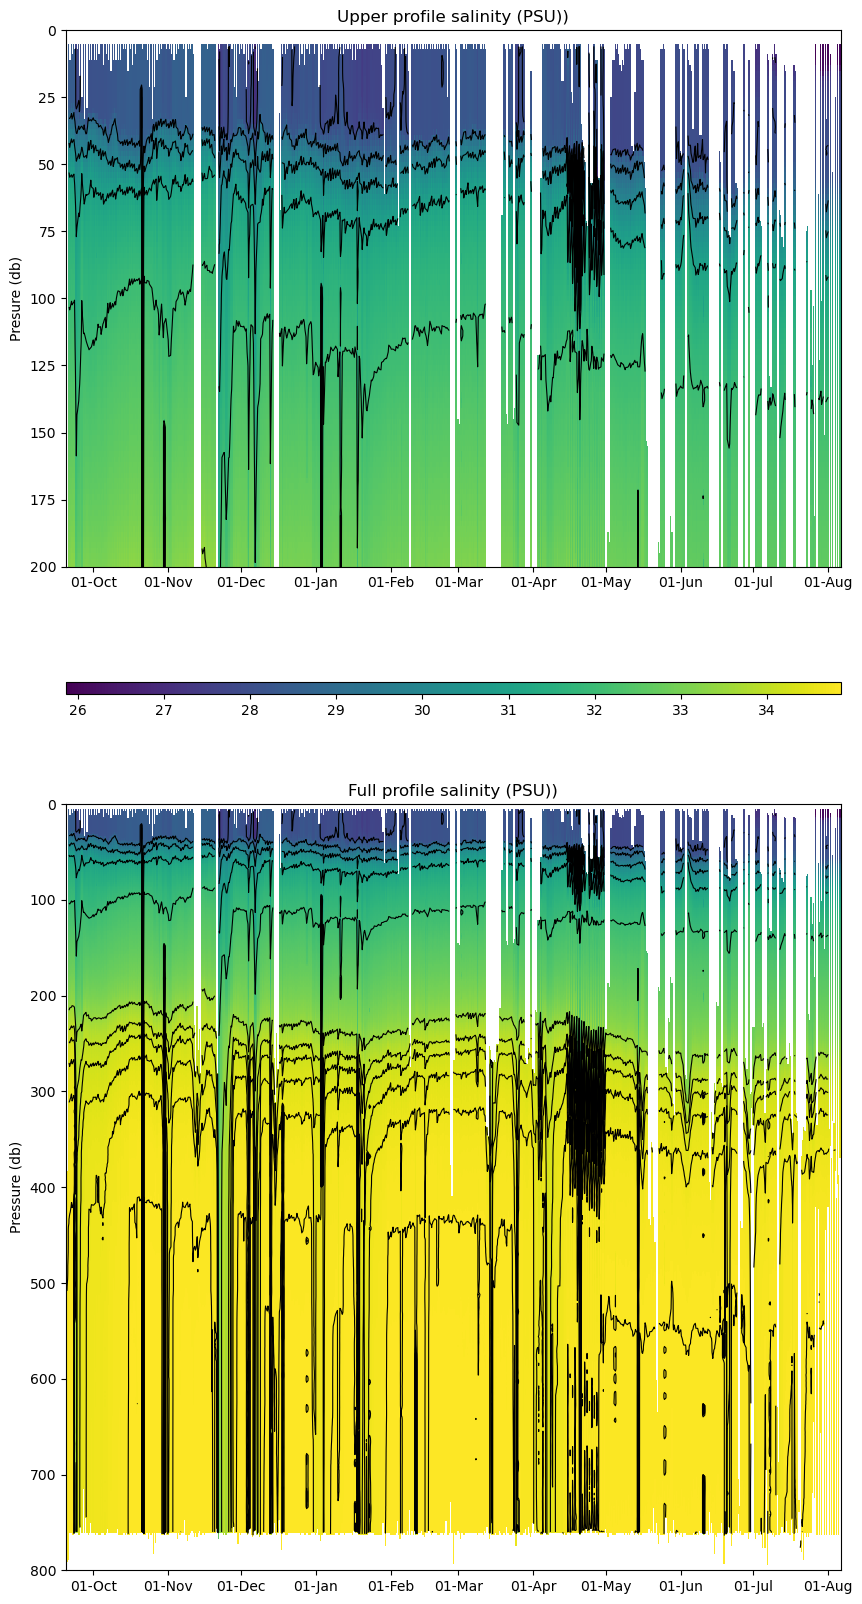
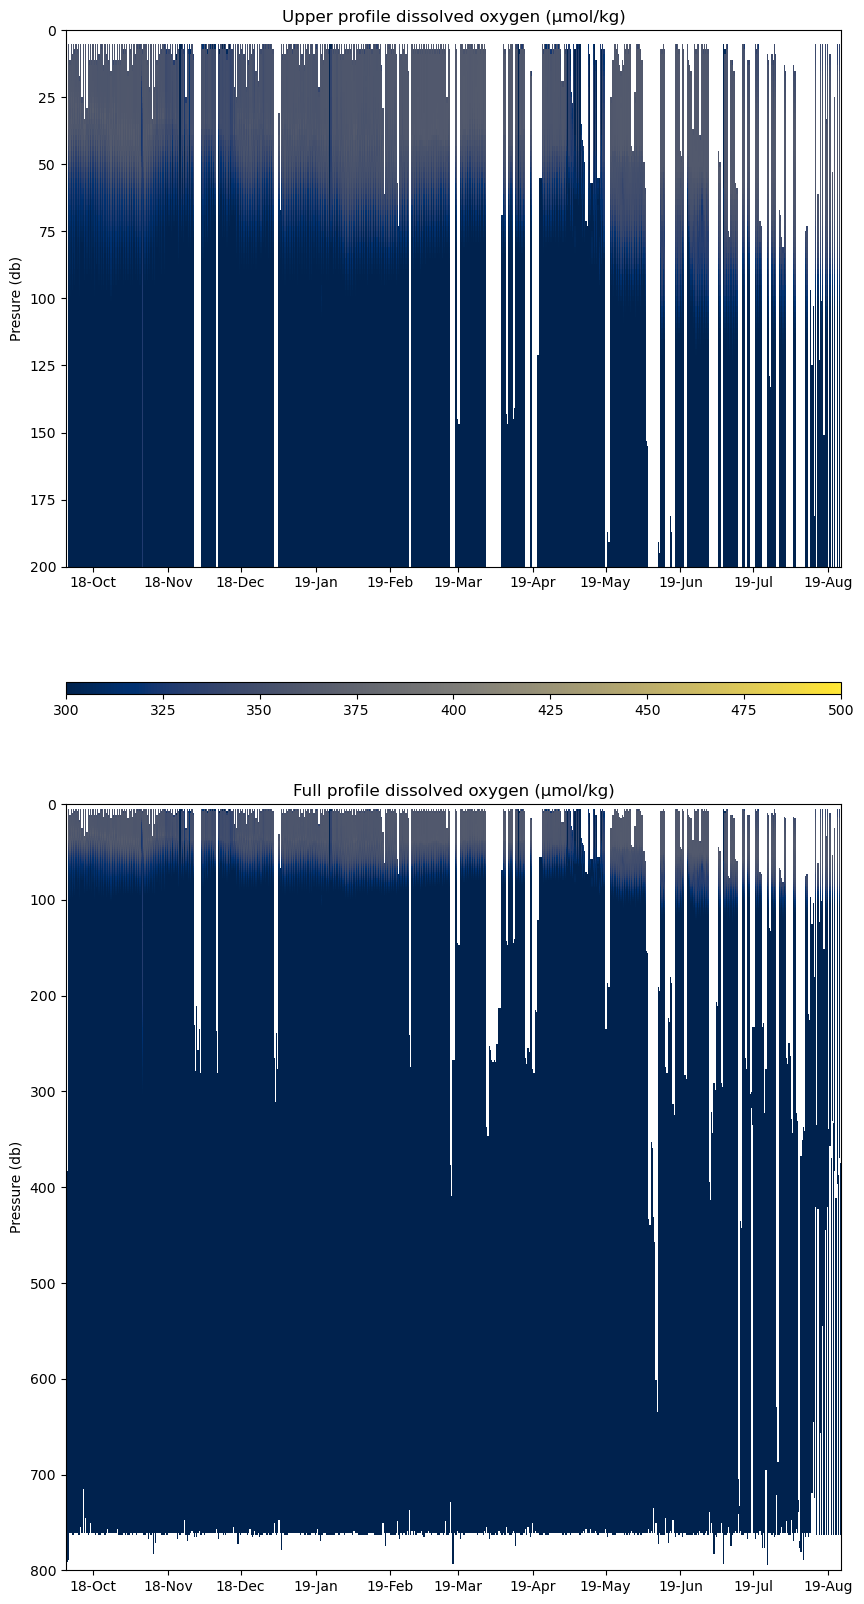
ITP110 was deployed on an 0.8 m ice floe in the Beaufort Sea on September 19, 2018 at 78° 1.4 N, 140° 15.0 W as part of the Beaufort Gyre Observing System (BGOS) during the JOIS 2018 cruise on the CCGS Louis S. St. Laurent. The ITP includes a dissolved oxygen sensor and is operating on a standard sampling schedule of 2 one-way profiles between 7 and 760 m depth each day and includes a fixed SAMI PCO2 with PAR and SBE-37 microcat with dissolved oxygen at 6 m depth.
| Temperature Contour Plot |
Salinity Contour Plot |
Profile History Plot |
 |
 |
 |
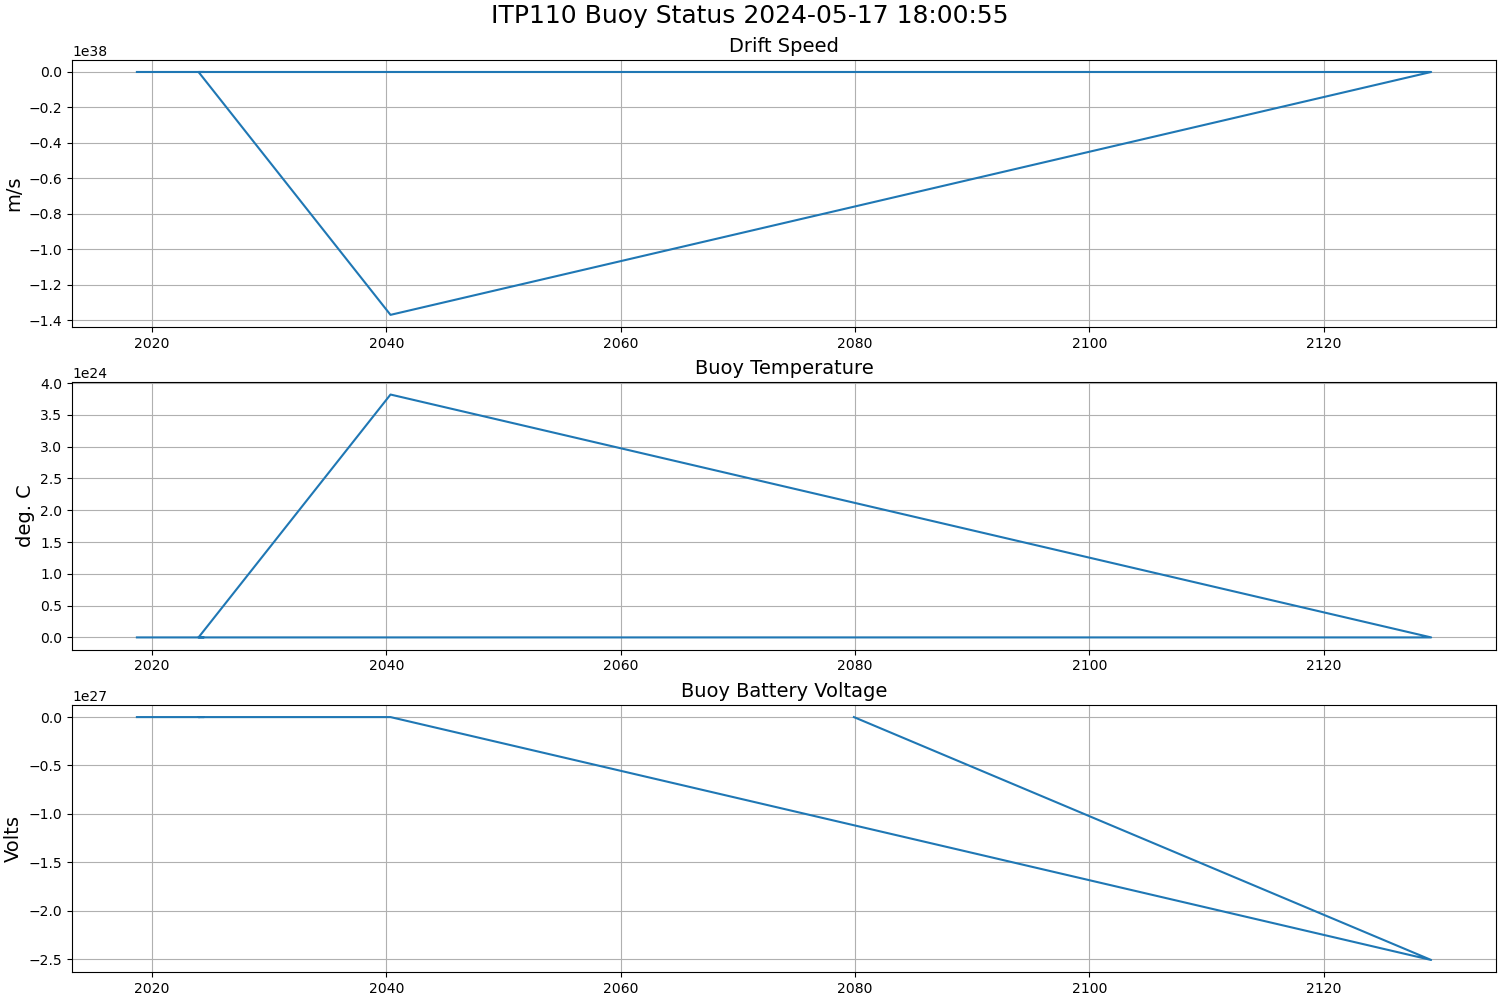
| Buoy Status |
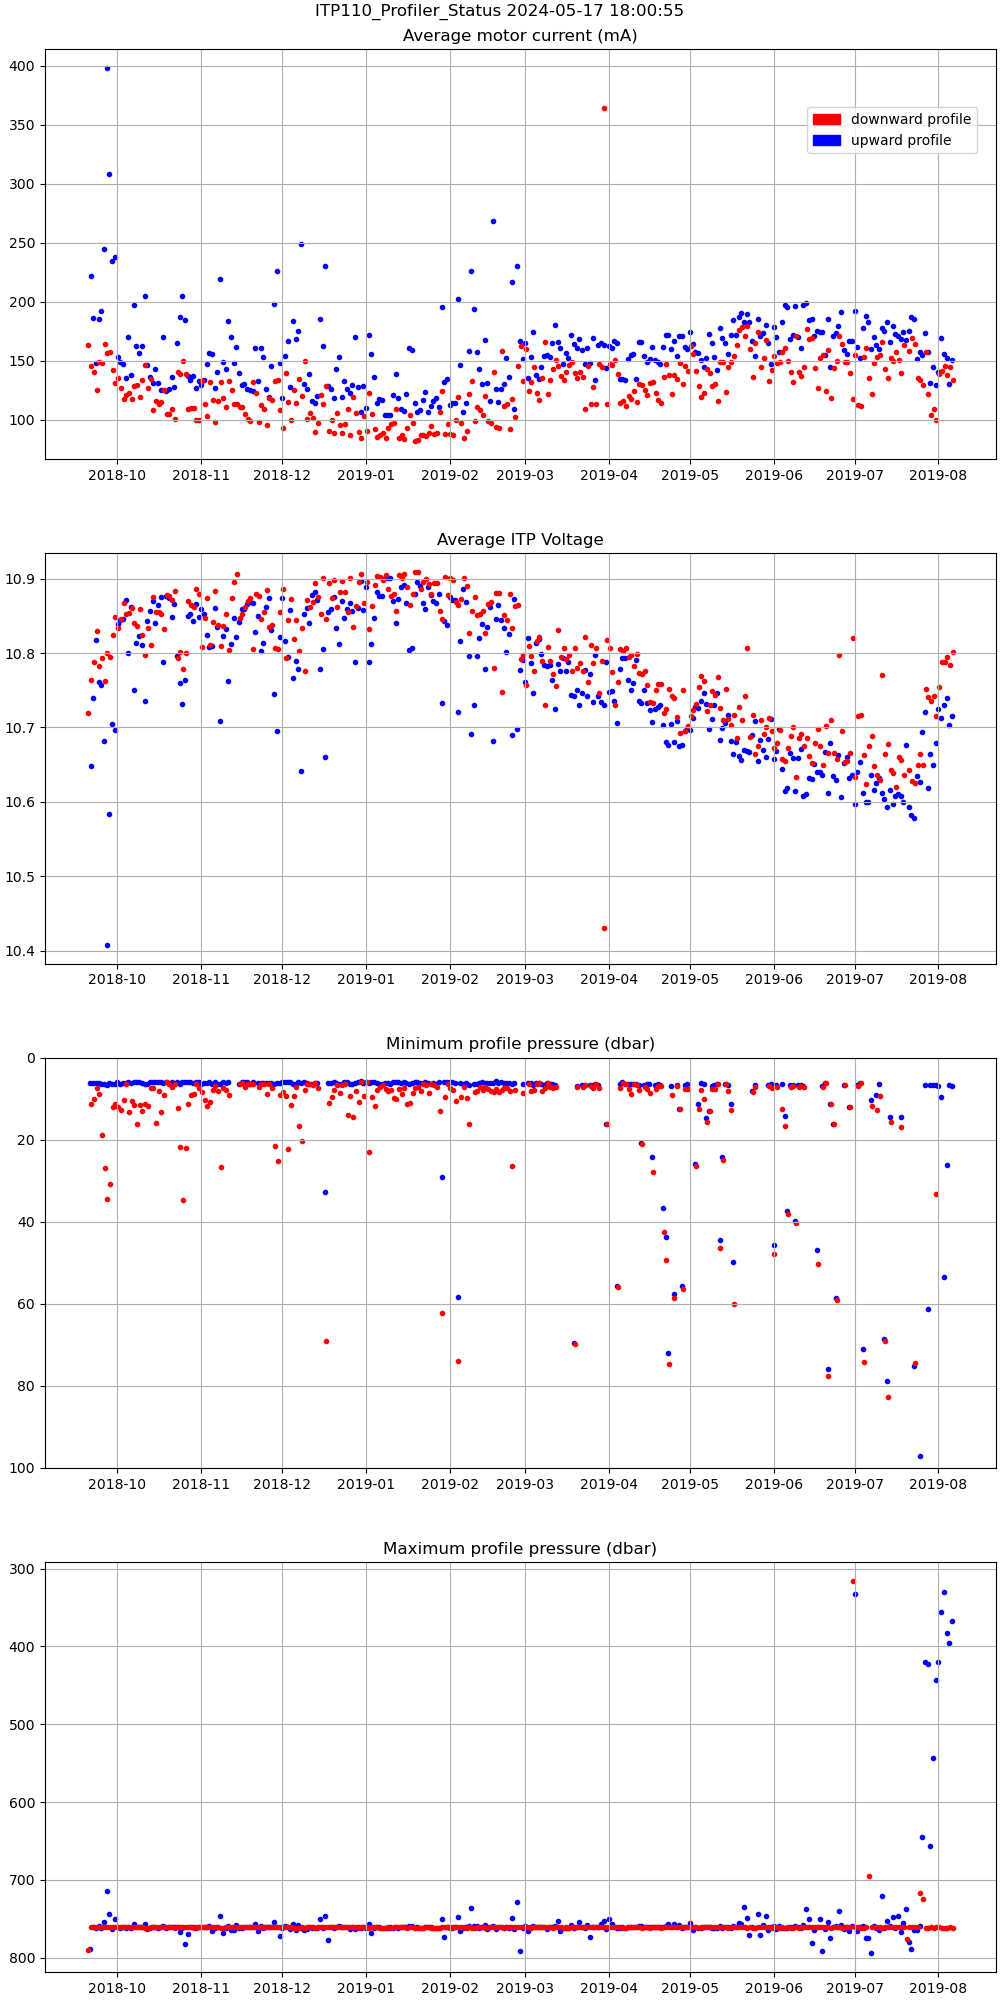
Profiler Status |
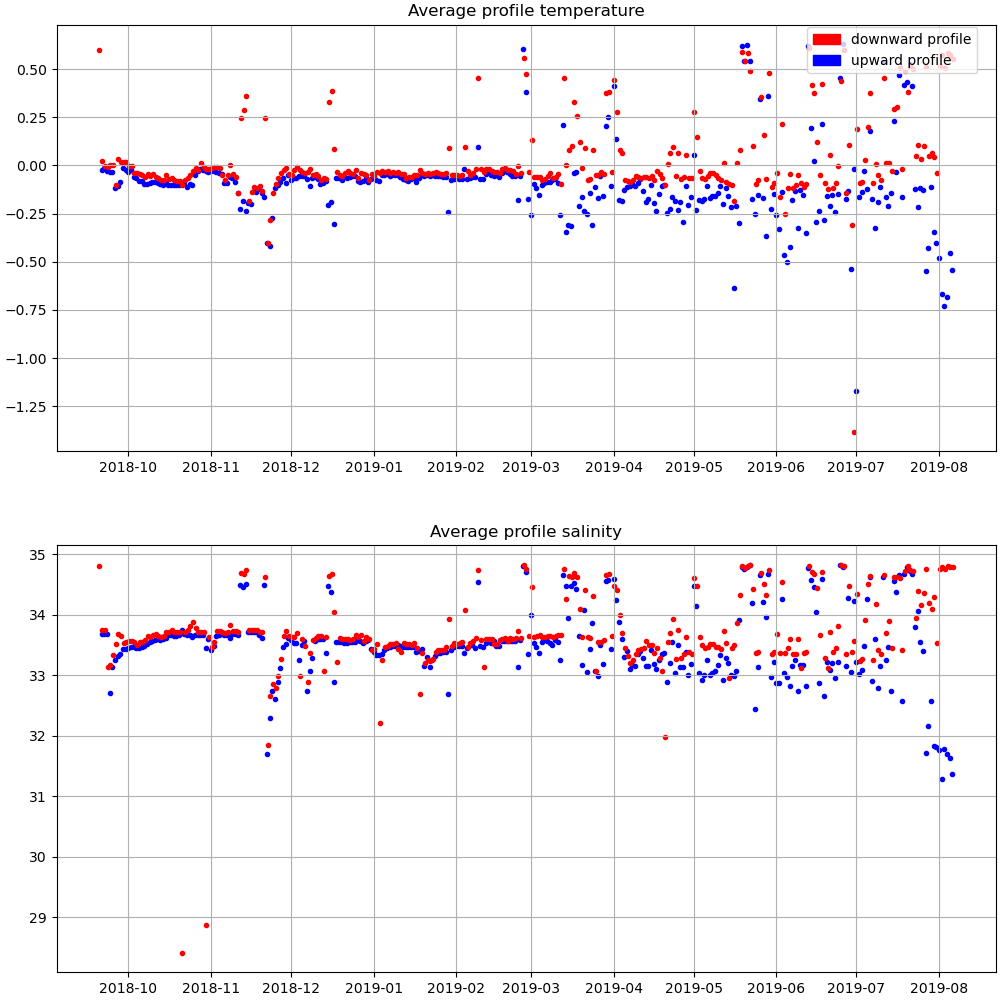
Mean Profile Temperature-Salinity |
 |
 |
 |
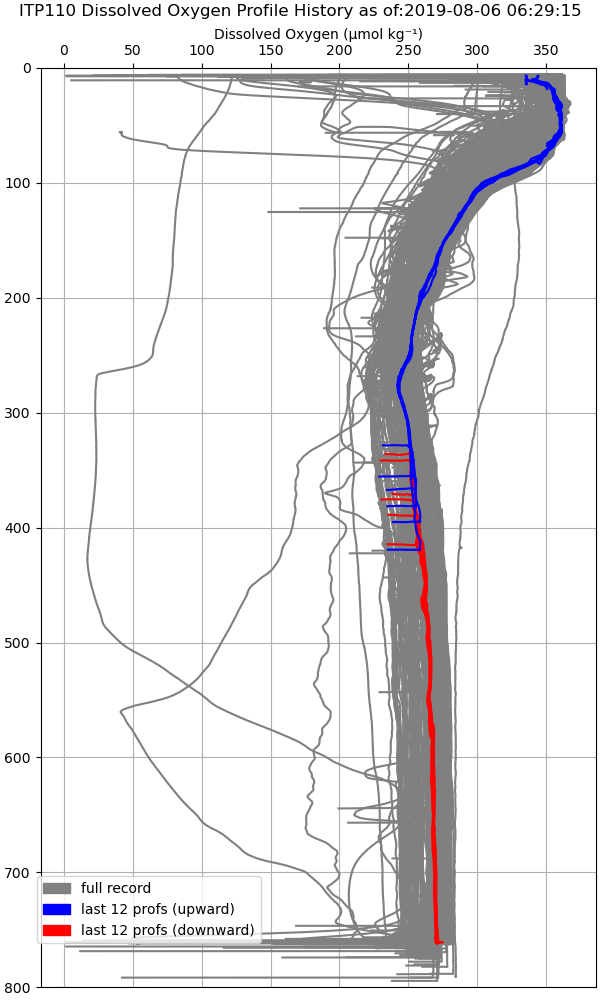
| Oxygen Profile History |
Oxygen Contour Plot |
 |
 |