|
|
 |
|
 |
|
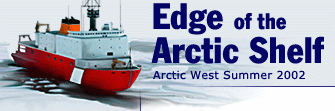
Dan Torres (foreground) and Jim Schmitt (background) use lines to control the CTD as it is lowered over the side of the ship. |
|
Click to enlarge |
Daily Update
Calendar
Dispatch 21 - August 4, 2002
By C.A. Linder
Weather conditions: overcast skies, winds 10 knots from the west, calm seas, air temperature 33° F.
Unsung Heroes
It was a cold gray Sunday on the Arctic Ocean today. A stiff wind blew ripples across the surface and a light mist intermittently doused the ship. Although it isn’t THAT cold outside, the drop of 14° F over 24 hours really makes it FEEL cold! While most of the ship savored the restful weekend routine by sleeping in, the science party and the Marine Science Division worked hard through the chilly night sampling with the CTD. In twelve hours, the crew deployed the CTD 11 times in a southeast-northwest line across Barrow Canyon, a 300 foot deep submarine canyon just offshore of Barrow, Alaska. We are interested in this area because the canyon acts as a channel, the same way an irrigation ditch works in your garden. This canyon helps guide some of the Pacific Ocean waters across the eastern Chukchi Sea to the deep Arctic Ocean basins.
 |
|
|
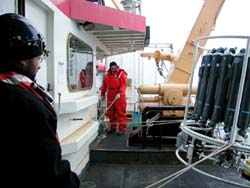
This is some water property data the CTD collected from the Beaufort slope waters.
|
|
Click to enlarge |
Today I thought I would show you one of the fruits of the CTD crew’s labors. Although our CTD package has many different sensors, let’s just start with looking at the temperature and salinity from a typical deep profile from the Beaufort slope. In the figure at left, you can see the way the temperature changes (red line) and how the salinity changes (blue line) with respect to depth. The surface is at the top of the plot, and the seafloor at the bottom of the plot. The values of temperature and salinity are indicated by the color coded bars at the top of the plot. Note that at the surface the water is relatively “warm” (compared to the water under it) and “fresh” (low salinity). Between the surface and 150 meters, the salinity increases rapidly with depth. Oceanographers call this feature a “halocline.” At the same point where the salinity is increasing, the temperature is getting colder - thus in the Arctic this layer is known as the “cold halocline layer.” Between 300 and 500 meters you can observe the water getting much warmer - this is known as the “Atlantic layer” since this water mass originated in the Atlantic Ocean. These are just some of the things that we can tell from just a single CTD cast. When you have a line of CTD casts (or “section”), you can view a cross-section of the ocean. We’ll look at one of those in tomorrow’s dispatch.
|
 |
|
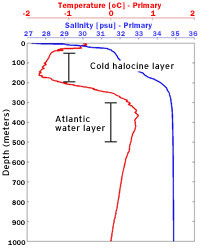
Aaron Morello prepares some sulfuric acid; he uses it in determining the amount of phosphate in the CTD water samples. |
|
Click to enlarge |
Despite the many challenges of working in the Arctic ice, there is one pleasure I have thus far neglected to mention - the calm seas! In fact, several crew members remarked that the ship actually moves more while it is at the pier in Seattle, Washington! There are three factors which affect how high waves can get: the strength of the wind, and the duration and “fetch” (area of open water) over which that wind blows. Most of the Arctic Ocean has calm seas because there are no areas of open water large enough to allow large waves to form. Since the fetch is the most important reason why the waves are small, the Arctic is a “fetch limited” sea. Although we have taken this for granted now, we may appreciate it more as we transit home through the Bering Sea... The Polar Star is constructed to be very efficient in breaking ice - it has a rounded hull and is pointy at both the bow and stern ends (it’s shaped like a football). If you can picture how a football would behave if you floated it in a tank of water, you can see why we are so especially thankful that we’re working in the ice!
 Previous Dispatch
Next Dispatch Previous Dispatch
Next Dispatch

Back to Calendar
|
|